Corpus
Consciousness and Complexity during Unresponsiveness Induced by Propofol, Xenon, and Ketamine
Simone Sarasso,1,11 Melanie Boly,2,3,11 Martino Napolitani,1,4 Olivia Gosseries,2,5 Vanessa Charland-Verville,5 Silvia Casarotto,1 Mario Rosanova,1 Adenauer Girardi Casali,6 Jean-Francois Brichant,7 Pierre Boveroux,7 Steffen Rex,8,9 Giulio Tononi,2 Steven Laureys,5,* and Marcello Massimini1,10,*
1Dipartimento di Scienze Biomediche e Cliniche ‘‘L. Sacco’’, Università degli Studi di Milano, 20157 Milan, Italy
2Department of Psychiatry, University of Wisconsin-Madison, Madison, WI 53719, USA
3Department of Neurology, University of Wisconsin-Madison, Madison, WI 53705, USA
4Dipartimento di Scienze Clinico-chirurgiche, Diagnostiche e Pediatriche, Sezione di Anestesia Rianimazione e Terapia Antalgica, Università degli Studi di Pavia, SC Anestesia e Rianimazione, Fondazione IRCCS Policlinico S. Matteo, 27100 Pavia, Italy
5Coma Science Group, University and University Hospital of Liège, GIGA-Research B34, 4000 Liège, Belgium
6Institute of Science and Technology, Federal University of São Paulo, 12231-280 São José dos Campos, Brazil
7Department of Anesthesia and Intensive Care Medicine, CHU Sart Tilman University Hospital, University of Liège, 4000 Liège, Belgium
8Department of Anaesthesiology, University Hospitals of the KU Leuven, KU Leuven, 3000 Leuven, Belgium
9Department of Cardiovascular Sciences, University Hospitals of the KU Leuven, KU Leuven, 3000 Leuven, Belgium
10Istituto Di Ricovero e Cura a Carattere Scientifico, Fondazione Don Carlo Gnocchi, 20148 Milan, Italy
11Co-first author
Correspondence: steven.laureys@ulg.ac.be (S.L.), marcello.massimini@unimi.it (M.M.) article link
Highlights
- The perturbational complexity index (PCI) in propofol and xenon anesthesia is low
- Both these anesthetics are associated with the lack of postanesthesia reports
- Ketamine is associated with high PCI and by vivid postanesthesia dream reports
- PCI may index the presence of disconnected consciousness during unresponsiveness
In Brief
Sarasso, Boly, et al. show that the complexity of the cortical response to TMS is low during propofol and xenon anesthesia but high during ketamine. Crucially, no reports are obtained upon awakening from both propofol and xenon while after ketamine, all subjects report long, vivid dreams, possibly indicating a state of disconnected consciousness.
Summary
A common endpoint of general anesthetics is behavioral unresponsiveness [1], which is commonly associated with loss of consciousness. However, subjects can become disconnected from the environment while still having conscious experiences, as demonstrated by sleep states associated with dreaming [2]. Among anesthetics, ketamine is remarkable [3] in that it induces profound unresponsiveness, but subjects often report ‘‘ketamine dreams’’ upon emergence from anesthesia [4–9]. Here, we aimed at assessing consciousness during anesthesia with propofol, xenon, and ketamine, independent of behavioral responsiveness. To do so, in 18 healthy volunteers, we measured the complexity of the cortical response to transcranial magnetic stimulation (TMS)—an approach that has proven helpful in assessing objectively the level of consciousness irrespective of sensory processing and motor responses [10]. In addition, upon emergence from anesthesia, we collected reports about conscious experiences during unresponsiveness. Both frontal and parietal TMS elicited a low-amplitude electroencephalographic (EEG) slow wave corresponding to a local pattern of cortical activation with low complexity during propofol anesthesia, a high-amplitude EEG slow wave corresponding to a global, stereotypical pattern of cortical activation with low complexity during xenon anesthesia, and a wakefulness-like, complex spatiotemporal activation pattern during ketamine anesthesia. Crucially, participants reported no conscious experience after emergence from propofol and xenon anesthesia, whereas after ketamine they reported long, vivid dreams unrelated to the external environment. These results are relevant because they suggest that brain complexity may be sensitive to the presence of disconnected consciousness in subjects who are considered unconscious based on behavioral responses.
Results
TMS during Unresponsiveness Reveals Drug-Specific Cortical Reactivity Patterns
Transcranial magnetic stimulation (TMS)-evoked electroencephalographic (EEG) potentials (TEPs) recorded at the stimulation site in the various experimental conditions (responsive wakefulness, propofol-, xenon-, and ketamine-induced unresponsiveness) are depicted in Figure 1A for all the participants in the study. As in previous studies [11], TEPs recorded after stimulation of both Brodmann area (BA) 6 and BA 7 during responsive wakefulness (Ramsay score 2) before drug administration were low-amplitude, fast-frequency recurrent scalp waves (Figure 1A, gray traces). After drug administration and behavioral unresponsiveness (Ramsay score 6), we observed distinct, drug-specific TEP patterns that were consistent across participants. During propofol-induced unresponsiveness, we recorded low-amplitude, low-frequency positive-negative TEPs (Figure 1A, left). Xenon-induced unresponsiveness was associated with largeamplitude but stereotyped positive-negative TEPs (Figure 1A, middle). Finally, during ketamine-induced unresponsiveness, TEPs were characterized by fast-frequency components closely resembling those evoked during wakefulness (Figure 1A, right). These results were confirmed when measuring the global mean field power (GMFP) for each TMS-EEG session across participants and sessions (Figure 1B). During wakefulness, the GMFP time course induced by TMS was highly reproducible across experiments (see Figure S1), in line with previous experiments [12]. During propofol-induced unresponsiveness, GMFP was reduced as compared to wakefulness soon after the first components (p < 0.05 at 91–94, 102–141, and 247–287 ms post-TMS). In contrast, xenon significantly increased GMFP both at early and late time points (p < 0.05 at 33–38 and 77–157 ms). Finally, ketamine GMFP was similar to wakefulness except for a reduction at late time points (p < 0.05 at 248–280 ms post-TMS).
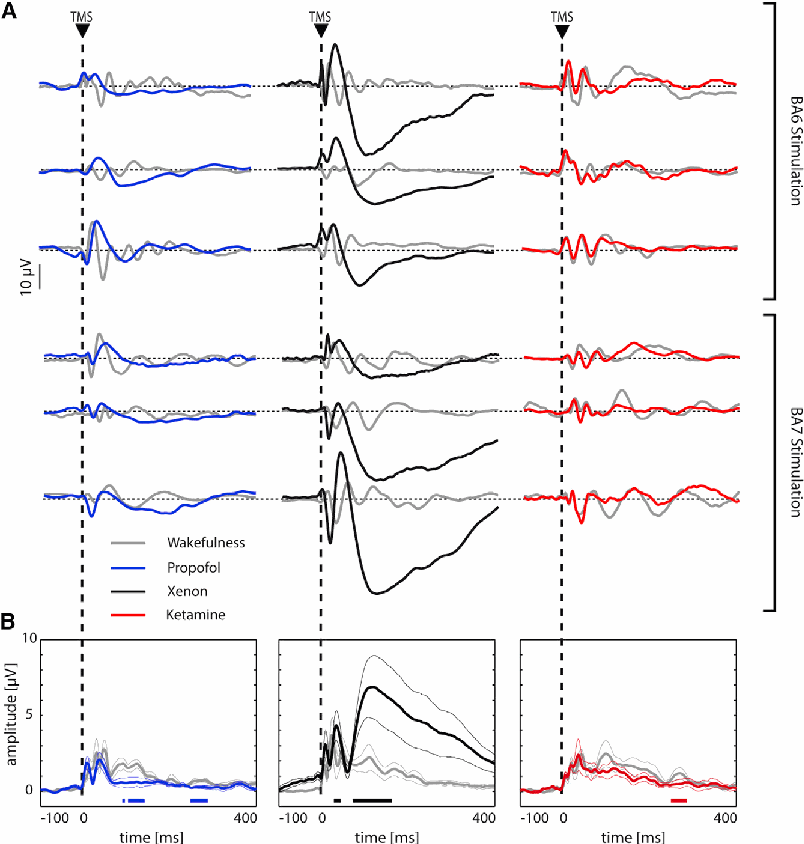
Figure 1. Different Patterns of Cortical Reactivity Induced by Propofol, Xenon, and Ketamine Anesthesia (A) Averaged TMS-evoked potentials during wakefulness (gray traces), propofol (left, blue traces), xenon (middle, black traces), and ketamine (right, red traces) are shown for a representative EEG derivation located under the TMS coil for each of the 18 participants.
(B) Global cortical reactivity as measured by the global mean field power (GMFP) in the three experiments. Each trace (color coded as in A) represents the grand average (thick line) ± SEM (thin lines) GMFP normalized for each participant on the mean baseline value (100 ms pre-stimulus). For each experiment, statistical comparison between wakefulness and drug-induced unresponsiveness was performed by means of t tests on individual GMFP time series values. Color-coded, horizontal bars at the bottom of each panel represent significant time points (pairwise comparisons p < 0.05). Statistical comparisons of global cortical reactivity during the wakefulness condition across the three experiments are presented in Figure S1A. The effect of the three anesthetics on the spontaneous EEG activity patterns is presented Figure S2. See also Figures S1 and S2.
We then characterized the spatiotemporal dynamics of TEPs by computing the corresponding cortical current density. Figure 2 shows the representative voltage and current maps during wakefulness as well as under propofol-, xenon-, and ketamineinduced unresponsiveness. As compared to wakefulness (Figure 2A), propofol-induced unresponsiveness was associated with local, short-lasting currents that did not propagate from the stimulated cortical site (white cross in Figure 2B). On the other hand, xenon resulted in a long-lasting, global response. This response was characterized by a large negative deflection associated with long-range, long-lasting currents that spread broadly to the surrounding cortex from a fixed local maximum (white cross in Figure 2C). In contrast, ketamine-induced unresponsiveness was characterized by a low-amplitude, complex wave associated with a spatially and temporally differentiated cortical activation pattern. In this case, the instantaneous maximum of cortical activation shifted over time among distant cortical areas (white cross in Figure 2D) giving rise to a widespread and complex response strongly resembling that obtained during wakefulness. We then quantified these results by generating a binary matrix from TMS-evoked significant cortical activations (Figure 3A), cumulated between 8 and 400 ms (Figure 3B). The resulting values were normalized within experiment for the wakefulness condition (see Figure S1). Results showed a larger spatiotemporal activation during xenon-induced unresponsiveness as compared to both propofol and ketamine condition (one-way ANOVA: F(2,15) = 8.47, p = 0.003; pairwise comparison p < 0.05, Bonferroni corrected). In addition, the overall spatiotemporal activation during propofol-induced unresponsiveness was significantly reduced compared to wakefulness (mean ratio ± SEM: 0.31 ± 0.08; n = 6; Wilcoxon test, Z = 2.2, p < 0.05).
Finally, based on the same spatiotemporal matrices, we derived the perturbational complexity index (PCI) [13]. Figure 3C illustrates PCI values for the three experiments. A mixed-model ANOVA showed a clear ‘‘experiment’’ 3 ‘‘condition’’ interaction (F(2,15) = 18.08, p = 0.0001). No difference was observed for wakefulness PCI values across experiments (Figure S1). Pairwise comparisons highlighted a decrease in complexity of the TMS/ EEG response for both propofol-induced (mean: 0.24, range: 0.20 to 0.30) and xenon-induced (mean: 0.17, range: 0.08 to 0.24) unresponsiveness condition as compared to wakefulness (propofol experiment mean: 0.50, range: 0.42 to 0.59; xenon experiment mean: 0.47, range: 0.44 to 0.53; p < 0.05, Bonferroni corrected). On the other hand, ketamine-induced unresponsiveness was characterized by high PCI values (mean: 0.44, range: 0.35 to 0.55), comparable to those obtained during wakefulness (ketamine experiment mean: 0.48, range: 0.41 to 0.58; p > 0.05).
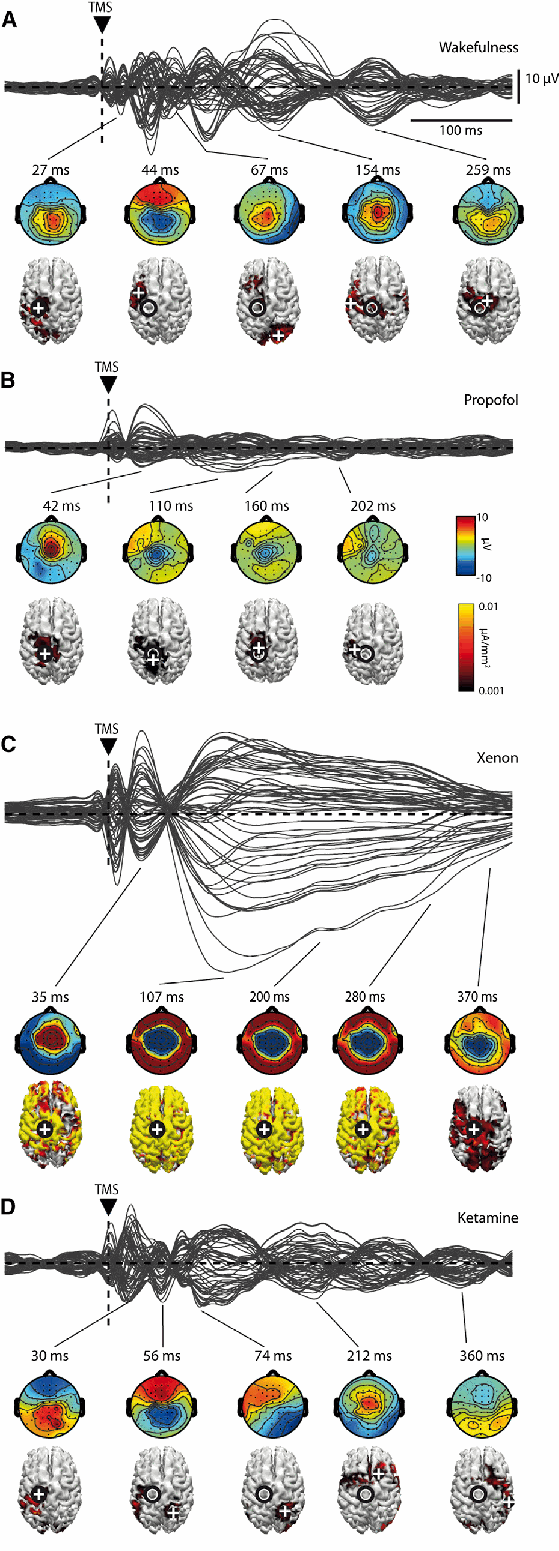
Figure 2. Different Spatiotemporal Dynamics Induced by Propofol, Xenon, and Ketamine
(A–D) Representative averaged TMS-evoked potentials at all electrodes, superimposed in butterfly plots together with voltage topographies and absolute cortical current density reconstructions estimated with L2 norm in periods of significant TMS-evoked activation during wakefulness (A), propofol (B), xenon (C), and ketamine (D). Black circle superimposed to the cortical surface represents TMS target; the current density distribution is thresholded to highlight the location of maximum current sources (white cross). The effect of the three anesthetics on the spontaneous EEG activity patterns is presented in Figure S2. See also Figure S2.
Drug-Induced Unresponsiveness Is Characterized by an Increase of Low-Frequency EEG Power
Changes in spontaneous EEG induced by the three anesthetics are reported in Figure S2. Overall, as compared to wakefulness, anesthetics induced a significant global increase in the amplitude of EEG traces accompanied by the occurrence of highamplitude slow waves (Figure S2A). These were prominent, frequent, and rhythmic in the case of propofol and xenon (mean number of waves/min ± SEM propofol: 12.78 ± 2.88; xenon: 24.31 ± 3.82; data not shown) and sporadic as well as polymorphic in the case of ketamine (mean number of waves/min ± SEM: 2.77 ± 1.19; data not shown). Spectral analysis (Figure S2B) revealed increased slow wave activity (SWA; 0.5–4.5 Hz) for all three anesthetics (p < 0.05), but to a greater extent for propofol and xenon than for ketamine (oneway ANOVA: F(2,15) = 15.37, p = 0.001; pairwise comparison p < 0.05, Bonferroni corrected). Theta (5–8 Hz) power was also increased by all three anesthetics (p < 0.05) to a similar extent (one-way ANOVA: F(2,15) = 0.18, p > 0.05). Sigma (12–16 Hz) power increased (p < 0.05) only during propofol-induced unresponsiveness. Finally, power in the gamma frequency range (30–40 Hz) was decreased (p < 0.05) by xenon and increased (p < 0.05) by ketamine.
Retrospective Reports Are Present Only after Ketamine Anesthesia
Participants anesthetized with propofol or xenon did not report any conscious experiences when questioned upon emergence. One participant of the xenon experiment reported the impression of having felt something just before awakening but had no explicit recall. In contrast, all the participants of the ketamine experiment reported having experienced full-fledged dreams during the unresponsiveness phase, as previously reported [4–7, 9]. In all cases, the dream reports shared the following: (1) they contained many vivid experiences rich in visual and emotional components; (2) they had an explicit narrative structure; (3) they were extended in time; and (4) they were unrelated to the anesthesia environment. In addition to dreams, immediately upon emergence from ketamine unresponsiveness, four out of six participants reported hallucinations and perceptual distortions of the surroundings, also as previously reported [7]. A representative excerpt from a ketamine dream report after emergence is included in the Supplemental Information.
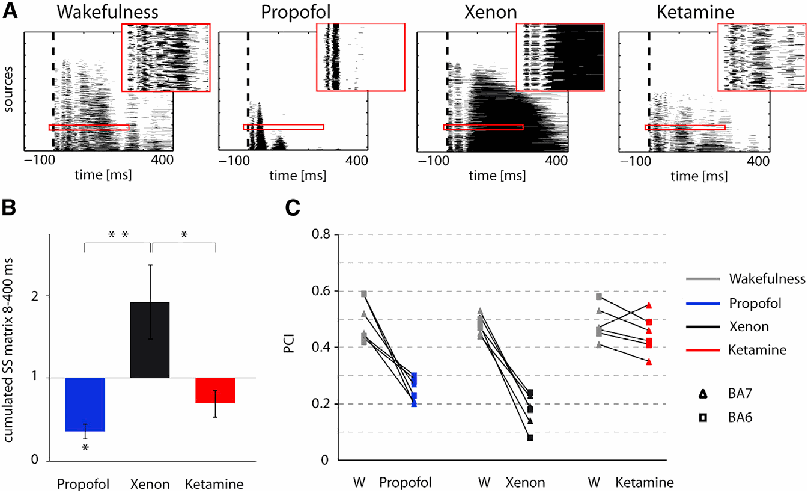
Figure 3. Overall Extent and Complexity of the Spatiotemporal Activations Induced by Propofol, Xenon, and Ketamine (A) Representative examples of the binarized spatiotemporal matrices of significant sources (black marks: active source at a given time point; white otherwise) during wakefulness, propofol, xenon, and ketamine. In each matrix, sources are sorted from bottom to top according to their total amount of significant activation during the post-stimulus period. Vertical dashed line represents the time point in which TMS is delivered. The insets within the red frames show an expanded portion of the spatiotemporal matrix to highlight its structure at a finer grain. (B) Average (±SEM) binarized significant postTMS currents across cortical sources and time points (cumulated between 8 and 400 ms postTMS) during propofol (blue), xenon (black), and ketamine (red). For each participant, values have been normalized for the values obtained in the wakefulness (W) condition. Statistical comparisons of global cortical reactivity during the wakefulness condition between the three experiments are presented in Figure S1B. *p < 0.05, **p < 0.005. (C) Individual PCI values for the three experiments in the two conditions. Triangles indicate BA7 while squares indicate BA6 TMS cortical targets. Statistical comparisons of PCI values during the wakefulness condition across the three experiments are presented in Figure S1C. See also Figure S1.
Discussion
In this study, we evaluated EEG responses to TMS during wakefulness and during behavioral unresponsiveness induced by propofol, xenon, and ketamine. We found that the complexity of EEG responses was high during wakefulness, low when subjects reported no conscious experiences upon emergence from anesthesia (propofol and xenon), and high when they reported intense dreams (ketamine).
During propofol, TMS triggered a low-amplitude, local positive-negative wave (Figure 1) that rapidly faded without propagating from the stimulated cortical site (Figure 2). Intracranial recordings during propofol-induced unresponsiveness suggest that the occurrence of asynchronous, local slow waves associated with periods of neuronal spiking suppression (down states) may substantially impair cortico-cortical communication [14]. The present study corroborates this view by showing that the neuronal effects of TMS remain confined to the stimulated site. The main effect of propofol is a strong enhancement of GABAergic inputs [15], which are likely involved in initiating down states in cortical neurons after an initial activation [16]. Large-scale computational models also suggest that increased inhibition is a potent mechanism for blocking cortico-cortical communication [17]. Hence, the local positive-negative wave elicited by TMS under propofol may reflect a local down state due to an increase in GABA inhibition that immediately gates corticocortical interactions. Consistent with this view, EEG responses to TMS delivered under anesthetic doses of midazolam, a benzodiazepine also potentiating GABA neurotransmission, are similar to those obtained with propofol, namely an initial cortical activation that remains local and fades rapidly [18]. Although the observed changes in cortical responsiveness during propofol may be contributed for by thalamic [19] and other subcortical [20] mechanisms, their role cannot be directly assessed in the current experiments.
During xenon anesthesia, instead, TMS triggered an initial positive component followed by a high-amplitude, stereotypical negative wave (Figure 1) that spread like an oil spot to the rest of the cortex (Figure 2). This pattern closely resembles the one evoked by high-intensity TMS during NREM sleep as well as spontaneously occurring sleep slow waves [21]. During NREM sleep, cortical neurons engage in large-scale bistable dynamics [22, 23] and oscillate synchronously between a depolarized up state and a hyperpolarized down state, which is reflected by a high-amplitude negative deflection in the scalp EEG. The key permissive factor that allows for the occurrence of global down states during sleep is the increased conductance of K+ channels due to the reduced firing of brainstem neuromodulatory systems [24]. Since xenon strongly potentiates the conductance of 2PK+ channels [15], in addition to antagonizing NMDA receptors, it may induce a state of diffuse cortical bistability through a similar mechanism. Hence, the large negative wave evoked by TMS during xenon anesthesia may reflect the occurrence of a widespread down state engaging large portions of the cortex, similar to evoked [25] and spontaneous [26, 27] sleep slow waves.
Finally, during ketamine-induced unresponsiveness, TMS evoked a series of fast, recurrent waves of activation (Figure 1) giving rise to a complex, long-range spatiotemporal dynamics closely resembling that evoked during wakefulness (Figure 2). While ketamine also antagonizes NMDA receptors, it does not potentiate GABA receptor activity like propofol, or K+ currents like xenon, which may explain why it may not be as effective in disrupting the complexity of cortico-cortical interactions. Furthermore, unlike propofol [28] and some inhalation anesthetics [29], ketamine increases cortical acetylcholine concentrations [30]. A TMS/EEG response similar to that evoked by ketamine can also be recorded during REM sleep [31], a state of high cholinergic tone [32] during which subjects almost invariably experience dreams [33, 34]. Notably, during ketamine unresponsiveness, TMS evoked complex patterns of cortical interactions in a state that, at difference with REM, was characterized by the occurrence of high-amplitude slow waves in the spontaneous EEG (see Figure S2) and by unarousable unresponsiveness (Ramsay score 6).
The complexity of TMS-evoked activations was quantified by applying the PCI metric [13]. PCI computes the algorithmic compressibility of TMS-evoked deterministic activations and is high only when the initial perturbation is transmitted to a large set of integrated areas that react in a differentiated manner and low otherwise. Thus, PCI captures the joint presence of functional integration and functional differentiation in cortical circuits, which is considered a fundamental requirement for consciousness [35–37]. During both propofol and xenon, PCI values were comparable and invariably lower than in wakefulness across participants and stimulated sites. Notably, PCI was equally low despite the substantial difference in the extent of the activation evoked by TMS during propofol and xenon unresponsiveness (Figure 3C). Specifically, during propofol, PCI dropped because the matrix of activation engaged by TMS was spatially restricted (Figure 3A, second column), consistent with a loss of integration; during xenon, instead, PCI dropped because the pattern of spatiotemporal activation triggered by TMS was a widespread but stereotypical slow wave (Figure 3A, third column), consistent with a loss of differentiation. By contrast, the spatiotemporal activation during ketamine-induced unresponsiveness showed a complex pattern (Figure 3A, fourth column) leading to PCI values that were always higher than the ones obtained during propofol and xenon and comparable to those achieved during wakefulness (Figure 3C).
Complexity, Consciousness, and Responsiveness
Upon awakening from both propofol and xenon anesthesia, characterized by low PCI, all participants (n = 12) reported having had no conscious experience and/or no recall. On the other hand, when emerging from ketamine unresponsiveness, all participants (n = 6) reported conscious experience under the form of long, vivid dreams. The present report of ‘‘ketamine dreams’’ is consistent with many previous studies with pure ketamine anesthesia. In a large proportion of cases, subjects who had been unresponsive at surgical levels reported upon awakening, either spontaneously or upon questioning, that they had experienced dreams unrelated to the operating room [4, 6–9]. Assessing consciousness through retrospective reports requires a note of caution because subjects may forget their dreams or may confabulate upon awakening. However, the systematic collection of retrospective reports remains the only available procedure to behaviorally assess consciousness above and beyond responsiveness, allowing for the possibility of internally generated and stimulus-independent experiences to be recognized [38]; as such, dream reports upon awakening are commonly employed to study mentation during sleep [2, 34]. In the present study, it is unlikely that all subjects forgot their dreams upon awakening from propofol and xenon anesthesia because participants (1) were healthy volunteers with no memory deficits, (2) underwent the administration of a single anesthetic agent, and (3) were prompted for a report a few minutes after recovery of responsiveness (see [38]). On the other hand, it is unlikely that the recalls of subjects undergoing ketamine anesthesia were solely affected by confabulation or hallucinations upon emergence and recovery of responsiveness. These reports, which were collected a few minutes after recovery of responsiveness and confirmed 1 hr later, were highly structured and explicitly narrative, were rich in emotional components, and were extended in time like full-fledged dreams. Moreover, the four participants who reported hallucinations were retrospectively able to discern a long phase during which experience was completely unrelated to the external environment from a final phase (occurring upon recovery of responsiveness), characterized by perceptual distortions of the surroundings, including the experimental setting. In this context, the finding of a complex pattern of cortical interactions, typical of the awake conscious state, throughout the state of ketamine-induced unresponsiveness provides strong support to the view that consciousness and behavioral responsiveness may decouple in various conditions [1], including pharmacological interventions and brain injury [39, 40].
The finding of high brain complexity (PCI) observed during unresponsiveness induced by ketamine anesthesia is interesting in the context of previous studies employing sensory-evoked potentials and functional connectivity analyses. For example, the late positive P3b evoked by auditory stimuli is equally suppressed during both propofol [41] and ketamine [42, 43], even at sub-anesthetic concentrations, and can be absent in awake subjects who do not pay attention to the stimulus [44]. Similarly, front-to-back functional connections were found to be selectively reduced both during propofol- and ketamine-induced unresponsiveness (though coherence is preserved [45, 46]) at dosages comparable to the ones employed in the present study and in the presence of a similar background EEG. A parsimonious explanation is that while event-related potentials and fronto-parietal functional connectivity may reflect connectedness to the environment or executive functions, measuring the overall complexity of cortico-cortical effective interactions with TMS-EEG may capture the brain’s capacity for experience as such, thus including ketamine dreams.
Conclusions
The present work aimed at differentiating states of equally deep unresponsiveness and profound disconnection from the external environment through direct cortical perturbations with TMS-EEG and retrospective reports. We find three distinct patterns of cortical reactivity to TMS underlying propofol-, xenon- and ketamine-induced unresponsiveness: a local, low-complexity response during propofol, a global, low-complexity response during xenon, and a complex spatio-temporal activation during ketamine. While the first two patterns are associated with loss of consciousness based on the lack of post-anesthesia reports, the complex pattern observed during ketamine precedes the report of vivid conscious experiences upon awakening. These findings are theoretically relevant, confirming the prediction that loss of consciousness during anesthesia is tied to a reduction of brain complexity, defined as the joint presence of functional integration and functional differentiation in neural systems [47], and may have practical implications for those vegetative state patients who, just like ketamine-anesthetized subjects, often show an EEG characterized by polymorphic delta activity and may be open eyed, unresponsive, but conscious.
Experimental Procedures
Here, we provide a brief summary of the experimental procedures. For full details, please refer to Supplemental Experimental Procedures. Eighteen healthy participants were randomly assigned to one of the three experiments (n = 6 for propofol, xenon, and ketamine, respectively). For each experiment, the EEG responses to TMS (150–200 pulses with a 2,000–2,300 ms randomly jittered period) performed over BA 6 (n = 3) and over BA 7 (n = 3) were recorded before drug administration, while the participants were fully responsive (Ramsay Scale score 2). TEPs were then recorded using the same stimulation parameters after subjects reached deep unresponsiveness (Ramsay Scale score 6, corresponding to no response external stimuli) following anesthesia administration. In addition, spontaneous EEG was also recorded during both wakefulness and unresponsiveness conditions. Finally, in order to assess the presence of conscious experience during anesthesia-induced behavioral unresponsiveness, retrospective reports were collected in all participants after awakening. We attained Ramsay Scale score 6 for all the subjects in the three experiments by employing anesthetic procedures based on previous works. Specifically, for propofol anesthesia see [45], for xenon see [48], while for ketamine we adopted induction procedures similar to [49] and anesthesia maintenance following several reports reviewed in [50]. TMS/EEG responses were quantified by calculating the GMFP [51] from the 60 channels averaged signals. Also, the primary electromagnetic sources of scalp EEG activity were calculated by performing source modeling, and the significant responses were estimated by applying a nonparametric bootstrap-based statistical procedure to TMS-evoked cortical currents as in [52]. The ensuing spatiotemporal matrices were then binarized and processed following the methods presented in [13] in order to derive PCI. Spontaneous EEG signals were analyzed computing power spectral density estimates with a 2-s Hamming window. Average power density across segments was computed for SWA, theta, alpha, sigma, beta, and gamma frequency bands. Data analysis was performed using the MATLAB (MathWorks) signal processing toolbox as well as custom scripts and EEGLAB (http://sccn.ucsd.edu/eeglab/) routines. Comparisons between conditions (wakefulness, unresponsiveness) within the same experiment were performed by means of the non-parametric Wilcoxon signed-rank test (p < 0.05). When testing differences across experiments, mixed-model ANOVAs were performed. To test contrasts, post hoc two-tailed t tests were used (p < 0.05, Bonferroni corrected).
Supplemental Information
Supplemental Information includes Supplemental Experimental Procedures and two figures and can be found with this article online at supplement link.
Author Contributions
M.B., J.-F.B., G.T., S.L., and M.M. designed the research. M.B., M.N., O.G., V.C.-V., S.C., M.R., P.B., S.R., and M.M. performed the research. S.S., M.N., S.C., and A.G.C. analyzed the data. S.S., M.B., G.T., and M.M. wrote the paper.
Acknowledgments
This work was supported by Prin 2010 (Italian Government), EU grant FP7-ICT2011-9, n. 600806 ‘‘Corticonic,’’ James S. McDonnell Foundation Scholar Award 2013, the Fonds de la Recherche Scientifique (FNRS), the James McDonnell Foundation, the Mind Science Foundation Tom Slick Award, the Belgian American Education Foundation, Wallonie-Bruxelles International, the French Speaking Community Concerted Research Action, and the University and University Hospital of Liège. The authors thank Marie-Aurelie Bruno and Didier Ledoux for helping with the data acquisition and Chiara Cirelli for insightful discussion. G.T. is involved in a research study on humans supported by Philips Respironics; this work is not related to the work presented in the current manuscript. S.R. has received a research grant from Air Liquide, France and from Air Liquide, Belgium.
References
-
Sanders, R.D., Tononi, G., Laureys, S., and Sleigh, J.W. (2012). Unresponsiveness ≠ unconsciousness. Anesthesiology 116, 946–959.
-
Stickgold, R., Malia, A., Fosse, R., Propper, R., and Hobson, J.A. (2001). Brain-mind states: I. Longitudinal field study of sleep/wake factors influencing mentation report length. Sleep 24, 171–179.
-
Domino, E.F. (2010). Taming the ketamine tiger. 1965. Anesthesiology 113, 678–684.
-
Langrehr, D., Alai, P., Andjelkovic, J., and Kluge, I. (1967). [On anesthesia using ketamine (CI-581): Report o 1st experience in 500 cases]. Anaesthesist 16, 308–318.
-
Collier, B.B. (1972). Ketamine and the conscious mind. Anaesthesia 27, 120–134.
-
Garfield, J.M., Garfield, F.B., Stone, J.G., Hopkins, D., and Johns, L.A. (1972). A comparison of psychologic responses to ketamine and thiopental–nitrous oxide–halothane anesthesia. Anesthesiology 36, 329–338.
-
Krestow, M. (1974). The effect of post-anaesthetic dreaming on patient acceptance of ketamine anaesthesia: a comparison with thiopentonenitrous oxide anaesthesia. Can. Anaesth. Soc. J. 21, 385–389.
-
Hejja, P., and Galloon, S. (1975). A consideration of ketamine dreams. Can. Anaesth. Soc. J. 22, 100–105.
-
Drummond, J.C., Brebner, J., Galloon, S., and Young, P.S. (1979). A randomized evaluation of the reversal of ketamine by physostigmine. Can. Anaesth. Soc. J. 26, 288–295.
-
Sarasso, S., Rosanova, M., Casali, A.G., Casarotto, S., Fecchio, M., Boly, M., Gosseries, O., Tononi, G., Laureys, S., and Massimini, M. (2014). Quantifying cortical EEG responses to TMS in (un)consciousness. Clin. EEG Neurosci. 45, 40–49.
-
Rosanova, M., Casali, A., Bellina, V., Resta, F., Mariotti, M., and Massimini, M. (2009). Natural frequencies of human corticothalamic circuits. J. Neurosci. 29, 7679–7685.
-
Casarotto, S., Romero Lauro, L.J., Bellina, V., Casali, A.G., Rosanova, M., Pigorini, A., Defendi, S., Mariotti, M., and Massimini, M. (2010). EEG responses to TMS are sensitive to changes in the perturbation parameters and repeatable over time. PLoS ONE 5, e10281.
-
Casali, A.G., Gosseries, O., Rosanova, M., Boly, M., Sarasso, S., Casali, K.R., Casarotto, S., Bruno, M.-A., Laureys, S., Tononi, G., and Massimini, M. (2013). A theoretically based index of consciousness independent of sensory processing and behavior. Sci. Transl. Med. 5, 198ra105–198ra105.
-
Lewis, L.D., Weiner, V.S., Mukamel, E.A., Donoghue, J.A., Eskandar, E.N., Madsen, J.R., Anderson, W.S., Hochberg, L.R., Cash, S.S., Brown, E.N., and Purdon, P.L. (2012). Rapid fragmentation of neuronal networks at the onset of propofol-induced unconsciousness. Proc. Natl. Acad. Sci. USA 109, E3377–E3386.
-
Franks, N.P. (2008). General anaesthesia: from molecular targets to neuronal pathways of sleep and arousal. Nat. Rev. Neurosci. 9, 370–386.
-
Chauvette, S., Crochet, S., Volgushev, M., and Timofeev, I. (2011). Properties of slow oscillation during slow-wave sleep and anesthesia in cats. J. Neurosci. 31, 14998–15008.
-
Esser, S.K., Hill, S., and Tononi, G. (2009). Breakdown of effective connectivity during slow wave sleep: investigating the mechanism underlying a cortical gate using large-scale modeling. J. Neurophysiol. 102, 2096–2111.
-
Ferrarelli, F., Massimini, M., Sarasso, S., Casali, A., Riedner, B.A., Angelini, G., Tononi, G., and Pearce, R.A. (2010). Breakdown in cortical effective connectivity during midazolam-induced loss of consciousness. Proc. Natl. Acad. Sci. USA 107, 2681–2686.
-
Baker, R., Gent, T.C., Yang, Q., Parker, S., Vyssotski, A.L., Wisden, W., Brickley, S.G., and Franks, N.P. (2014). Altered activity in the central medial thalamus precedes changes in the neocortex during transitions into both sleep and propofol anesthesia. J. Neurosci. 34, 13326–13335.
-
Mhuircheartaigh, R.N., Rosenorn-Lanng, D., Wise, R., Jbabdi, S., Rogers, R., and Tracey, I. (2010). Cortical and subcortical connectivity changes during decreasing levels of consciousness in humans: a functional magnetic resonance imaging study using propofol. J. Neurosci. 30, 9095–9102.
-
Massimini, M., Ferrarelli, F., Esser, S.K., Riedner, B.A., Huber, R., Murphy, M., Peterson, M.J., and Tononi, G. (2007). Triggering sleep slow waves by transcranial magnetic stimulation. Proc. Natl. Acad. Sci. USA 104, 8496–8501.
-
Sanchez-Vives, M.V., and McCormick, D.A. (2000). Cellular and network mechanisms of rhythmic recurrent activity in neocortex. Nat. Neurosci. 3, 1027–1034.
-
Timofeev, I., Grenier, F., and Steriade, M. (2000). Impact of intrinsic properties and synaptic factors on the activity of neocortical networks in vivo. J. Physiol. Paris 94, 343–355.
-
McCormick, D.A., Wang, Z., and Huguenard, J. (1993). Neurotransmitter control of neocortical neuronal activity and excitability. Cereb. Cortex 3, 387–398.
-
Pigorini, A., Sarasso, S., Proserpio, P., Szymanski, C., Arnulfo, G., Casarotto, S., Fecchio, M., Rosanova, M., Mariotti, M., Lo Russo, G., et al. (2015). Bistability breaks-off deterministic responses to intracortical stimulation during non-REM sleep. Neuroimage 112, 105–113.
-
Cash, S.S., Halgren, E., Dehghani, N., Rossetti, A.O., Thesen, T., Wang, C., Devinsky, O., Kuzniecky, R., Doyle, W., Madsen, J.R., et al. (2009). The human K-complex represents an isolated cortical down-state. Science 324, 1084–1087.
-
Menicucci, D., Piarulli, A., Allegrini, P., Laurino, M., Mastorci, F., Sebastiani, L., Bedini, R., and Gemignani, A. (2013). Fragments of wakelike activity frame down-states of sleep slow oscillations in humans: new vistas for studying homeostatic processes during sleep. Int. J. Psychophysiol. 89, 151–157.
-
Kikuchi, T., Wang, Y., Shinbori, H., Sato, K., and Okumura, F. (1997). Effects of ketamine and pentobarbitone on acetylcholine release from the rat frontal cortex in vivo. Br. J. Anaesth. 79, 128–130.
-
Shichino, T., Murakawa, M., Adachi, T., Arai, T., Miyazaki, Y., and Mori, K. (1998). Effects of inhalation anaesthetics on the release of acetylcholine in the rat cerebral cortex in vivo. Br. J. Anaesth. 80, 365–370.
-
Pal, D., Hambrecht-Wiedbusch, V.S., Silverstein, B.H., and Mashour, G.A. (2015). Electroencephalographic coherence and cortical acetylcholine during ketamine-induced unconsciousness. Br. J. Anaesth. 114, 979–989.
-
Massimini, M., Ferrarelli, F., Murphy, M., Huber, R., Riedner, B., Casarotto, S., and Tononi, G. (2010). Cortical reactivity and effective connectivity during REM sleep in humans. Cogn. Neurosci. 1, 176–183.
-
el Mansari, M., Sakai, K., and Jouvet, M. (1989). Unitary characteristics of presumptive cholinergic tegmental neurons during the sleep-waking cycle in freely moving cats. Exp. Brain Res. 76, 519–529.
-
Nir, Y., and Tononi, G. (2010). Dreaming and the brain: from phenomenology to neurophysiology. Trends Cogn. Sci. 14, 88–100.
-
Siclari, F., Larocque, J.J., Postle, B.R., and Tononi, G. (2013). Assessing sleep consciousness within subjects using a serial awakening paradigm. Front. Psychol. 4, 542.
-
Tononi, G., and Edelman, G.M. (1998). Consciousness and complexity. Science 282, 1846–1851.
-
Seth, A.K., Izhikevich, E., Reeke, G.N., and Edelman, G.M. (2006). Theories and measures of consciousness: an extended framework. Proc. Natl. Acad. Sci. USA 103, 10799–10804.
-
Oizumi, M., Albantakis, L., and Tononi, G. (2014). From the phenomenology to the mechanisms of consciousness: integrated information theory 3.0. PLoS Comput. Biol. 10, e1003588.
-
Noreika, V., Jylhänkangas, L., Móró, L., Valli, K., Kaskinoro, K., Aantaa, R., Scheinin, H., and Revonsuo, A. (2011). Consciousness lost and found: subjective experiences in an unresponsive state. Brain Cogn. 77, 327–334.
-
Boly, M., Sanders, R.D., Mashour, G.A., and Laureys, S. (2013). Consciousness and responsiveness: lessons from anaesthesia and the vegetative state. Curr. Opin. Anaesthesiol. 26, 444–449.
-
Naci, L., Cusack, R., Anello, M., and Owen, A.M. (2014). A common neural code for similar conscious experiences in different individuals. Proc. Natl. Acad. Sci. USA 111, 14277–14282.
-
Sneyd, J.R., Samra, S.K., Davidson, B., Kishimoto, T., Kadoya, C., and Domino, E.F. (1994). Electrophysiologic effects of propofol sedation. Anesth. Analg. 79, 1151–1158.
-
Oranje, B., van Berckel, B.N., Kemner, C., van Ree, J.M., Kahn, R.S., and Verbaten, M.N. (2000). The effects of a sub-anaesthetic dose of ketamine on human selective attention. Neuropsychopharmacology 22, 293–302.
-
Watson, T.D., Petrakis, I.L., Edgecombe, J., Perrino, A., Krystal, J.H., and Mathalon, D.H. (2009). Modulation of the cortical processing of novel and target stimuli by drugs affecting glutamate and GABA neurotransmission. Int. J. Neuropsychopharmacol. 12, 357–370.
-
Picton, T.W. (1992). The P300 wave of the human event-related potential. J. Clin. Neurophysiol. 9, 456–479.
-
Murphy, M., Bruno, M.-A., Riedner, B.A., Boveroux, P., Noirhomme, Q., Landsness, E.C., Brichant, J.-F., Phillips, C., Massimini, M., Laureys, S., et al. (2011). Propofol anesthesia and sleep: a high-density EEG study. Sleep 34, 283–91A.
-
Blain-Moraes, S., Lee, U., Ku, S., Noh, G., and Mashour, G.A. (2014). Electroencephalographic effects of ketamine on power, cross-frequency coupling, and connectivity in the alpha bandwidth. Front. Syst. Neurosci. 8, 114.
-
Alkire, M.T., Hudetz, A.G., and Tononi, G. (2008). Consciousness and anesthesia. Science 322, 876–880.
-
Rex, S., Schaefer, W., Meyer, P.H., Rossaint, R., Boy, C., Setani, K., Büll, U., and Baumert, J.H. (2006). Positron emission tomography study of regional cerebral metabolism during general anesthesia with xenon in humans. Anesthesiology 105, 936–943.
-
Lee, U., Ku, S., Noh, G., Baek, S., Choi, B., and Mashour, G.A. (2013). Disruption of frontal-parietal communication by ketamine, propofol, and sevoflurane. Anesthesiology 118, 1264–1275.
-
Miller, A.C., Jamin, C.T., and Elamin, E.M. (2011). Continuous intravenous infusion of ketamine for maintenance sedation. Minerva Anestesiol. 77, 812–820.
-
Lehmann, D., and Skrandies, W. (1980). Reference-free identification of components of checkerboard-evoked multichannel potential fields. Electroencephalogr. Clin. Neurophysiol. 48, 609–621.
-
Lv, J., Simpson, D.M., and Bell, S.L. (2007). Objective detection of evoked potentials using a bootstrap technique. Med. Eng. Phys. 29, 191–198.
Supplemental Information: Figures and Methods
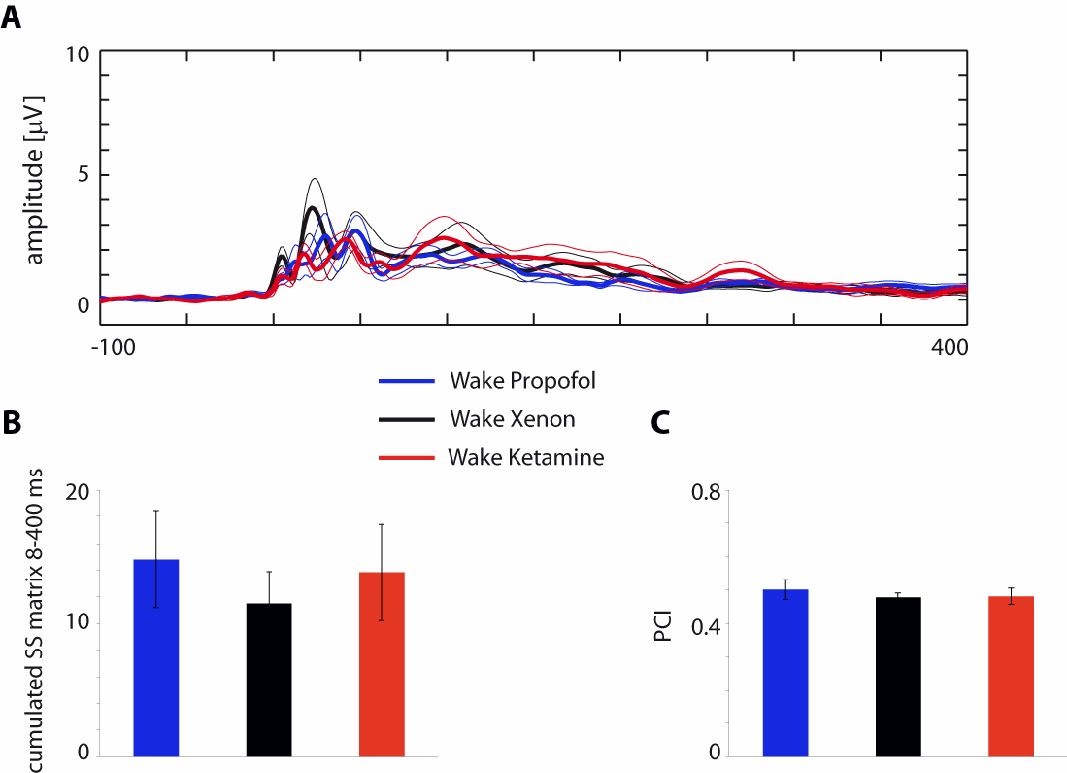
Figure S1. For all the investigated parameters wakefulness conditions were comparable across experiments (Related to Figure 1 and Figure 3). A, global cortical reactivity as measured by the Global Mean Field Power (GMFP) in the three experiments for the wakefulness condition. Each trace (color coded) represents the grand average (thick line) ± SEM (thin lines) GMFP normalized for each participant on the mean baseline value (100 ms pre-stimulus). For each experiment, a large overlap of GMFP time-course is visible, confirmed by separate pairwise T-tests performed on individual GMFP time-series values (same as in Figure 1B). No time-point returned significant differences (p>0.05) for any of the contrasts. B, average (± SEM) binarized significant post-TMS currents across cortical sources and time-points (cumulated between 8 and 400 ms post-TMS) during wakefulness for the propofol, xenon, and ketamine experiments color-coded as in A. A One-way ANOVA showed no main experiment effect F(2, 15)=.27, p=.77. C, average (± SEM) PCI values for the propofol, xenon, and ketamine experiments color-coded as in A and B. A One-way ANOVA showed no main experiment effect F(2, 15)=.27, p=.77.
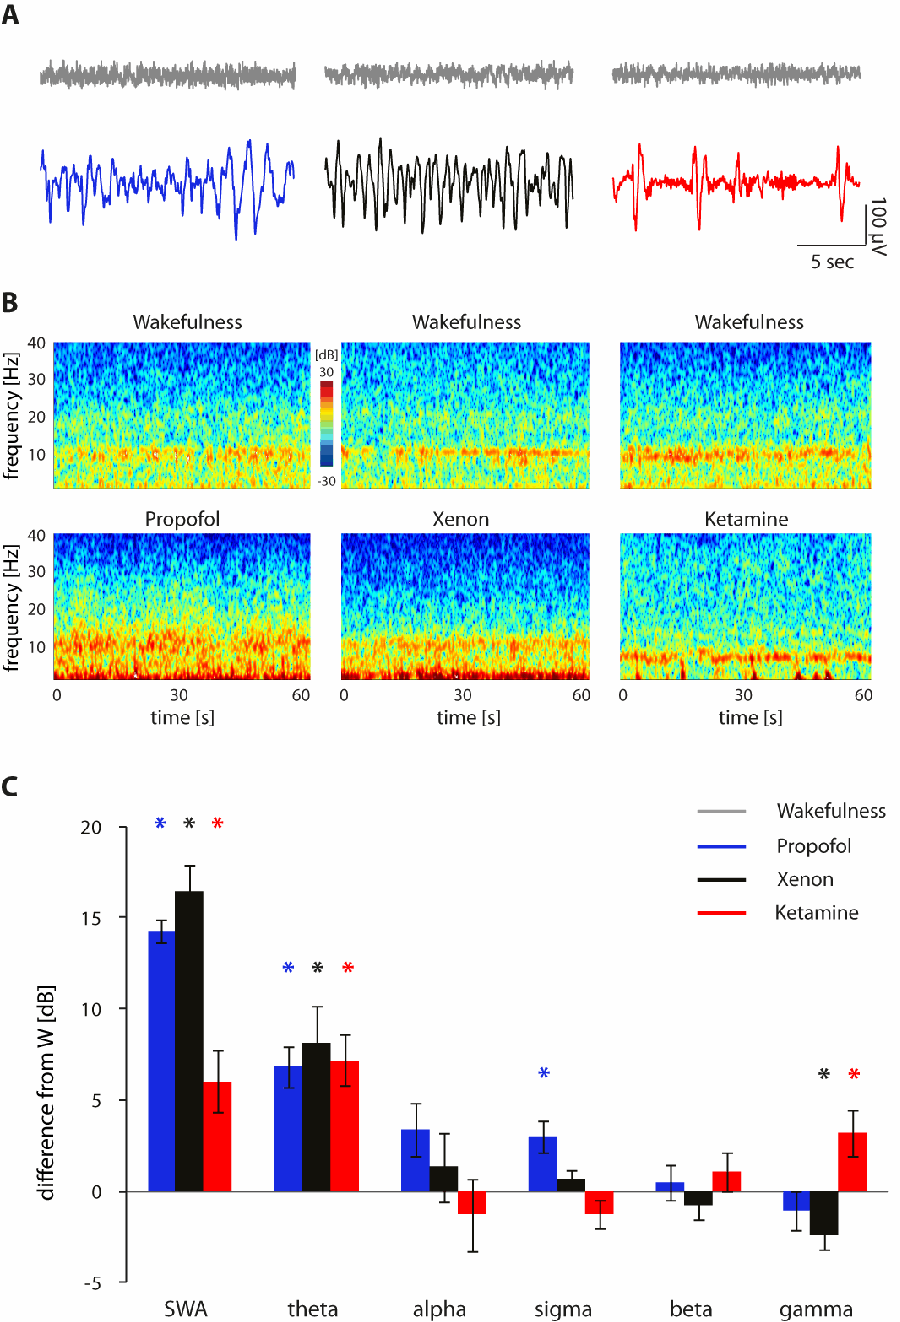
Figure S2. Effects of propofol, xenon and ketamine on spontaneous EEG (Related to Figure 1 and Figure 2).
A, representative 20-second epochs derived from electrode Fz for each experiment and condition (wakefulness, grey traces; propofol, blue traces; xenon, black traces; ketamine, red traces). B, representative spectrograms (Short-time Fourier transform applied on 1-s windows with 0.1 s overlap, binsize: 0.01Hz) calculated over 1 min of continuous EEG signal derived from electrode Fz for each experiment and condition (wakefulness, top row; propofol, bottom left; xenon, bottom middle; ketamine, bottom right). C, spectral values calculated by averaging each participant’s power spectral density in the specified frequency range bins (see Supplemental Experimental Procedures) across the 60 electrodes. Bars represent the average (± SEM) spectral density difference (in dB) from wakefulness (W) for the different frequency ranges across participants. Color-coded asterisks indicate significant difference from wakefulness (p<0.05).
Supplemental Experimental Procedures
Participants
Eighteen healthy participants (8 males, age 18–28 years) were enrolled in the study. All subjects gave written informed consent. The experimental protocol was approved by the local ethical committee of the University of Liège (Liège, Belgium). Before the experiment, medical history and physical examinations were performed to exclude medical conditions that were incompatible with the anesthesia and/or the TMS procedure. TMS was performed in accordance with current safety guidelines [S1,S2]. After inclusion in the experimental protocol, participants were randomly assigned to one of the three experiments (N=6 for propofol, xenon and ketamine, respectively).
Procedures
All experimental procedures were performed at the Centre Hospitalier Universitaire (CHU) in Liege, Belgium. Only one type of anesthetic was administered to a given participant. For each experiment half of the subjects were stimulated over Broadmann Area (BA) 6 and half over BA 7. For each experiment, a first 6 to 8-min TMS-EEG session (up to 250 stimuli, with a 2000-2300ms randomly jittered period) was collected before drug administration while the participants were fully responsive (Ramsay Scale score 2). Following drug administration, repeated assessments of respon siveness were performed at 30-s intervals and, upon reaching deep unresponsiveness (Ramsay Scale score 6, corresponding to no response external stimuli) in three consecutive assessments, EEG recordings started and a TMS-EEG session was replicated adopting the same stimulation parameters (e.g. cortical target, intensity). During the responsive wakefulness condition, a 10-minute spontaneous EEG recording was performed before TMS-EEG was acquired, while during the drug-induced unresponsiveness condition spontaneous EEG was continuously acquired starting ~3 min before to ~3 min after TMS-EEG recordings. At the end of EEG recordings, anesthesia was discontinued, participants were allowed to recover, and assessments of responsiveness were continued every 30 s. Before the beginning of all experimental procedures, participants were given metoclopramide (2mg) to minimize possible complications in the event of nausea and vomiting caused by the anesthetic drug. In addition, participant’s electrocardiogram, non-invasive blood pressure, SaO2, exhaled CO2, and axillary skin temperature were continuously monitored.
In order to assess the presence/absence of conscio us experience during anesthesia-induced behavioral unresponsiveness, retrospective reports were collected in all participants after awakening. For this purpose, after participants recovered responsiveness (as assessed by three consecutive Ramsey Scale score 2 evaluations), they were asked to report their previous conscious experience (“what was going on through your mind before awakening?”). Participants were asked to confirm their retrospective reports one hour after recovering responsiveness. Experience was defined as “any kind of mental activity,” which included thoughts, dreams, images, emotions, etc. Responses were recorded and lumped into two categories: 1) no conscious experience/no recall; 2) conscious experiences, when the participant could describe the content of the experiences. Below we report a representative excerpt from a ketamine dream after emergence collected in one subject participating in the ketamine experiment:
‘First I had the feeling of falling backwards into space. […] I then found myself in a futuristic spatial vessellike environment, discussing with two people I know about some abstract theoretical problem I am interested in, and we concluded that there was no solution, and that we disagreed on some fundamental points. At the end of this brief discussion I came up with the strong conclusion that everything I thought before was wrong, that nothing I believed was true anymore […]. At this stage, the space of my dream
became slippery, I fell again with a feeling of shrinking space where everything became oblique, and I could see through the window a very large, white sphere in the intersideral space. […] I continued to fall and arrived in another room, still thinking that I had to find a solution to our theoretical problem using some kind of technology or way of calculation that did not exist yet; I had at that point a vision of a futuristic environment with a lot of machines, and some intense discussions with some unknown people about this mathematical problem. Then, reality started to fade and shrink further, the space of my dream flattened and virtually disappeared, and instead there was the apparition of something like a white and bright shape invading progressively the whole space. I would describe this scene as a beautiful end-of-the-world vision, with a real sensation of beauty, very impressive and strange, but no anxiety associated with it.’
TMS-EEG apparatus
For TMS, we employed a focal figure-of-eight coil (mean/outer winding diameter 50/70 mm, biphasic pulse shape, pulse length 280 ms, focal area of the stimulation 0.68 cm2) driven by a Mobile Stimulator Unit (eXimia TMS Stimulator, Nexstim Plc., Finland). The targeted cortical areas were identified on each subject’s T1 anatomical MRI, acquired with a 3-T GE scanner. We controlled TMS parameters by means of a navigated brain stimulation (NBS) system (Nexstim Plc., Finland) employing a 3D infrared tracking position sensor unit to locate the relative positions of the co il and subject’s head within the reference space of individual MRI scans. NBS system also estimated, online, the distribution and the intensity (expressed in V/m) of the intracranial electric field induced by TMS. Across experiments, stimulation intensity was set at an intensity of about 110 V/m, above the threshold (50 V/m) for a significant EEG response [S3].
EEG measurements were performed using a TMS-compatible 60-channel EEG amplifier (Nexstim Plc., Finland). This device prevents amplifier saturation and reduces, or abolishes, the magnetic artifacts induced by the coil’s discharge via a sample-and-hold circuit activated about 50 ms before the TMS pulse and released 2.5 ms after [S4]. To further optimize TMS compatibility, the impedance at all electrodes was kept below 5 kΩ. EEG signals were referenced to an additional electrode on the forehead, filtered (0.1-350 Hz) and sampled at 1450 Hz. Two extra sensors were used to record the electrooculogram. Moreover,
participants wore inserted earplugs through which a noise masking, reproducing the time-varying frequency components of the TMS-associated “click”, was played throughout each TMS-EEG session in order to prevent “click”-induced EEG auditory evoked potentials [S5] as well as eye blinks or eye muscle reactions [S6]. Additionally, the bone conduction produced by the mechanical vibration of the TMS was minimized by placing a thin foam layer between the coil and the EEG cap [S7].
Anesthetic procedures
Given that the depth of anesthesia is hard to compare when using compounds acting on different molecular targets, the anesthetic procedures for the three experiments were aimed at reaching a common behavioral state, i.e. unresponsiveness, systematically assessed by means of repeated Ramsey Scale administrations. Thus, we attained Ramsay Scale score 6 for all the subjects in the three experiments by employing anesthetic procedures based on previous works.
Propofol. Propofol anesthesia was induced by a certified senior anesthesiologist through an intravenous catheter placed into a vein of the right hand or forearm. Throughout the study, the subjects breathed spontaneously, and additional oxygen (5 liters/min) was given through a loosely fitting plastic face mask. Anesthesia was obtained with a target-controlled infusion (Alaris TIVA; CareFusion). The pump was controlled by a software algorithm based on the Marsh adult pharmacokinetic model for propofol [S8] set at 3µg/ml. When the appropriate effect site concentration was reached, a 5-minute equilibration period was allowed to ensure equilibration of propofol repartition between compartments.
Xenon. Xenon anesthesia was induced by a certified senior anesthesiologist. Before xenon administration, we performed a denitrogenation with 100% oxygen applied via a facial mask. Once completed, a 2-3 mg/kg bolus of propofol was administered through a right arm or forearm intravenous catheter in order to allow the insertion of a laryngeal mask securing the airway. Xenon was then introduced progressively and propofol was withdrawn. We then waited for spontaneous reduction of plasmatic propofol concentration (propofol washout) until calculated propofol plasma concentration were below 1µg/ml, [S9], within a subanesthetic range [S10] after which anesthesia was maintained with xenon (62.5±2.5 % in oxygen) using
a Dräger PhysioFlex closed circuit ventilator (Dräger; Luebeck, Germany). Participants were undergoing assisted spontaneous ventilation with pressure control maintaining normocapnia and received a total amount of xenon ranging from 24 to 32 liters.
Ketamine. Ketamine anesthesia was induced by a certified senior anesthesiologist using a 2 mg/kg intravenous infusion (diluted in 10mL of 0.9% normal saline) of racemic ketamine (Ketalar®, Pfizer Ltd, Istanbul, Turkey) over 2 minutes and maintained by continuous ketamine infusion at 0.05 mg/kg/min (Baxter infusion pump AS40A; Baxter Healthcare Corp., Deerfield, IL) over the entire experimental procedures.
Spontaneous EEG Data Analysis
Spontaneous EEG data were off-line filtered (0.5–40 Hz) with a 3rd order IIR Butterworth digital filter with an attenuation of -3dB at 0.5 and 40 (using the filtfilt function in the Matlab signal processing toolbox). Bad channels were rejected based on visual inspection [≤ 10% of channels per recording; mixed-model ANOVA Experiment (Propofol, Xenon, Keamine) X Condition (Wakefulness, Unresponsiveness) F(2,15)=.88 p=.43]. Rejected channels were then interpolated using spherical splines. Continuous data were then split into contiguous 2-second segments (excluding those segments during which TMS-EEG recordings were performed). Segments containing movements were excluded from the analysis based on visual inspection (max/min retained EEG segments across experiments and conditions: 300/86). After reducing the number of independent component to the number of good, non-interpolated channels by performing Singular Value Decomposition, independent component analysis [ICA; [S11]] was used to remove ocular, muscle, and electrocardiograph artifacts using EEGLAB routines. Only ICA components with specific activity patterns and component maps characteristic of artifactual activity [S12] were removed [see [S13] for examples]. The signal for each channel was re-referenced to the average of all channels. For each EEG derivation, power spectral density estimates were computed by fast Fourier transform (FFT) in 2-s Hamming window (applying the pwelch function in the Matlab signal processing toolbox). Spectral power estimates were thus performed with a 0.5 Hz bin resolution. Average power density across segments was computed for Slow Wave Activity (SWA; 0.5-4.5Hz), theta (5-8 Hz), alpha (8-12 Hz), sigma (12-16 Hz), beta (16-30 Hz) and gamma (30-40 Hz) frequency bands.
TMS-EEG Data Analysis
Data analysis was performed using Matlab R2006a (The MathWorks). All trials that contained spontaneous blinks, eye movement, or muscle artifacts were rejected, channels with bad signal quality or large residual artifacts were excluded, EEG-data were filtered (0.5–45 Hz) with a 3rd order IIR Butterworth digital filter with an attenuation of -3dB at 0.5 and 45 (using the filtfilt function in the Matlab signal processing toolbox), sampled at 725Hz and referenced to the common average reference. Each TMS-evoked response was obtained by averaging 150-200 artifact-free trials [mixed-model ANOVA Experiment (Propofol, Xenon, Ketamine) X Condition (Wakefulness, Unresponsiveness) F(2,15)=.13 p=.87]. In order to quantify cortical reactivity, we measured the overall amount of electrical activity induced by TMS by calculating the Global Mean Field Power [GMFP] from the 60 channels averaged signals. Finally, the primary electromagnetic sources of scalp EEG activity were calculated by performing source modeling, and the significant responses were estimated by applying a nonparametric bootstrap-based statistical procedure to TMS-evoked cortical currents as in [S14]. The ensuing spatiotemporal matrices were then binarized and processed in order to derive the Perturbational Complexity Index (PCI), an empirical measure of brain complexity, which gauges the amount of information contained in the integrated response of the thalamocortical system to a direct perturbation calculated as the normalized Lempel-Ziv complexity of the spatiotemporal pattern of cortical activation triggered by the TMS perturbation.
Statistical Analysis
Comparisons between conditions (wakefulness, unresponsiveness) within the same experiment were performed by means of the non-parametric Wilcoxon signed-rank test (p<0.05). When testing differences across experiments, mixed-model analyses of variance (ANOVA) were performed. To test contrasts, post hoc two-tailed t-tests were used (p<0.05, Bonferroni corrected).
Supplemental References
-
S1. Wassermann EM. Risk and safety of repetitive transcranial magnetic stimulation: report and suggested guidelines from the International Workshop on the Safety of Repetitive Transcranial Magnetic Stimulation, June 5-7, 1996. Electroencephalogr Clin Neurophysiol 1998;108:1–16.
-
S2. Rossi S, Hallett M, Rossini PM, Pascual-Leone A, Safety of TMS Consensus Group. Safety, ethical considerations, and application guidelines for the use of transcranial magnetic stimulation in clinical practice and research. Clin Neurophysiol 2009;120:2008–39. doi:10.1016/j.clinph.2009.08.016.
-
S3. Casali AG, Casarotto S, Rosanova M, Mariotti M, Massimini M. General indices to characterize the electrical response of the cerebral cortex to TMS. Neuroimage 2010;49:1459–68. doi:10.1016/j.neuroimage.2009.09.026.
-
S4. Virtanen DJ, Ruohonen J, Näätänen R, Ilmoniemi RJ. Instrumentation for the measurement of electric brain responses to transcranial magnetic stimulation. Med Biol Eng Comput 1999;37:322–6. doi:10.1007/BF02513307.
-
S5. Nikouline V, Ruohonen J, Ilmoniemi RJ. The role of the coil click in TMS assessed with simultaneous EEG. Clinical Neurophysiology 1999;110:1325–8. doi:10.1016/S1388-2457(99)00070-X.
-
S6. Ilmoniemi RJ, Kičić D. Methodology for combined TMS and EEG. Brain Topography 2010;22:233–48. doi:10.1007/s10548-009-0123-4.
-
S7. Braack EM Ter, de Vos CC, van Putten MJAM. Masking the Auditory Evoked Potential in TMS-EEG: A Comparison of Various Methods. Brain Topogr 2015;28:520–8. doi:10.1007/s10548-013-0312-z.
-
S8. Marsh B, White M, Morton N, Kenny GN. Pharmacokinetic model driven infusion of propofol in children. Br J Anaesth 1991;67:41–8.
-
S9. Rex S, Schaefer W, Meyer PH, Rossaint R, Boy C, Setani K, et al. Positron emission tomography study of regional cerebral metabolism during general anesthesia with xenon in humans. Anesthesiology 2006;105:936–43.
-
S10. Fiset P, Paus T, Daloze T, Plourde G, Meuret P, Bonhomme V, et al. Brain mechanisms of propofolinduced loss of consciousness in humans: a positron emission tomographic study. J Neurosci 1999;19:5506–13.
-
S11. Delorme A, Makeig S. EEGLAB: an open source toolbox for analysis of single-trial EEG dynamics including independent component analysis. J Neurosci Methods 2004;134:9–21. doi:10.1016/j.jneumeth.2003.10.009.
-
S12. Jung TP, Makeig S, Humphries C, Lee TW, McKeown MJ, Iragui V, et al. Removing electroencephalographic artifacts by blind source separation. Psychophysiology 2000;37:163–78.
-
S13. Hulse BK, Landsness EC, Sarasso S, Ferrarelli F, Guokas JJ, Wanger T, et al. A postsleep decline in auditory evoked potential amplitude reflects sleep homeostasis. Clin Neurophysiol 2011;122:1549–55. doi:10.1016/j.clinph.2011.01.041.
-
S14. McCubbin J, Yee T, Vrba J, Robinson SE, Murphy P, Eswaran H, et al. Bootstrap significance of low SNR evoked response. Journal of Neuroscience Methods 2008;168:265–72. doi:10.1016/j.jneumeth.2007.10.003.