Corpus
Slides: Composition
The lab's transcriptions of the decks embedded on https://www.iit.wiki/axioms-and-postulates/composition: each slide's text as the deck shows it, and in square brackets a description of each diagram, which is the transcriber's and not the deck's.
Slideshow 1: Composition Postulate - 08/2023
Source page: Composition Source deck: Composition Postulate (50 slides)
Title slide (slide 1)
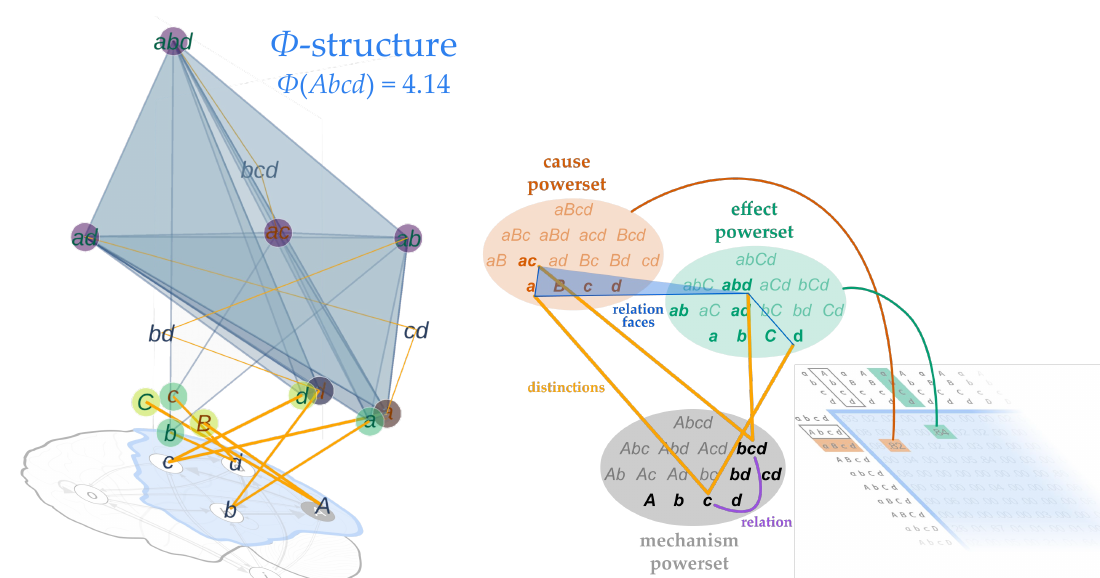
[On the left, the Φ-structure of the complex is drawn as a translucent blue-grey polyhedron standing above a faded brain, headed "Φ-structure" and "Φ(Abcd) = 4.14." Its lowest layer is "planted" on the complex's units on the brain; higher layers carry labels for larger sets of units (bd, cd, bcd, abd), and orange lines (distinctions) link mechanisms to their causes and effects, while blue edges and shaded surfaces (relations) connect overlapping causes and effects. On the right are three coloured ovals: an orange "cause powerset," a green "effect powerset" and a grey "mechanism powerset," each listing the subsets of the relevant state arranged by size. Orange lines labelled "distinctions" connect elements of the mechanism powerset with elements of the cause and effect powersets; a blue band labelled "relation faces" joins overlapping purviews; a purple outline labelled "relation" marks two mechanisms whose distinctions are related. Curved orange and green arrows lead from the cause and effect powersets down to a flattened, faded TPM. A red "(click)" prompt invites the reader to advance.]
From axiom to postulate (slides 2–5)
Axiom: Experience is structured: it is composed of distinctions and the relations that bind them together, yielding a phenomenal structure that feels the way it feels.
How can we formulate this phenomenal property in physical terms—that is, in terms of cause–effect power?
Postulate: The cause–effect power of the substrate of consciousness must be structured: subsets of units must specify cause–effects over subsets of units (distinctions) that can overlap with one another (relations), yielding a cause–effect structure that is the way it is.
Note that these slides give a conceptual overview of the postulate without going into the mathematics. Use the links to learn more about key concepts, and visit the Computing Φ page for technical details.
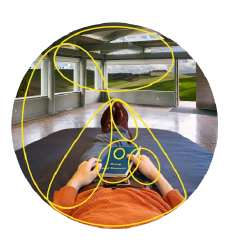
[Beneath the axiom is the round photograph of the wiki's sample experience, a first-person view of lying on a bed with a book in a bright room with wide windows. Thin yellow outlines are drawn over it, tracing parts of the scene (the book, the hands, the body, the bed, the room and its windows) and nesting smaller parts inside larger ones, standing for the distinctions and relations that make up the experience. A blue arrow leads from the axiom to the postulate, which is set above the question.]
The complex on the brain (slides 6–8)
In the exclusion postulate, we determined that our main complex was Abcd (blue shaded area).
We'll place our substrate model on the brain now, suggesting that the main complex comprises posterior areas of the cerebral cortex (though obviously comprising a few orders of magnitude more units).
The composition postulate now requires us to unfold the causal structure specified by the complex—that is, to determine all of the causal distinctions and relations specified by subsets of Abcd.
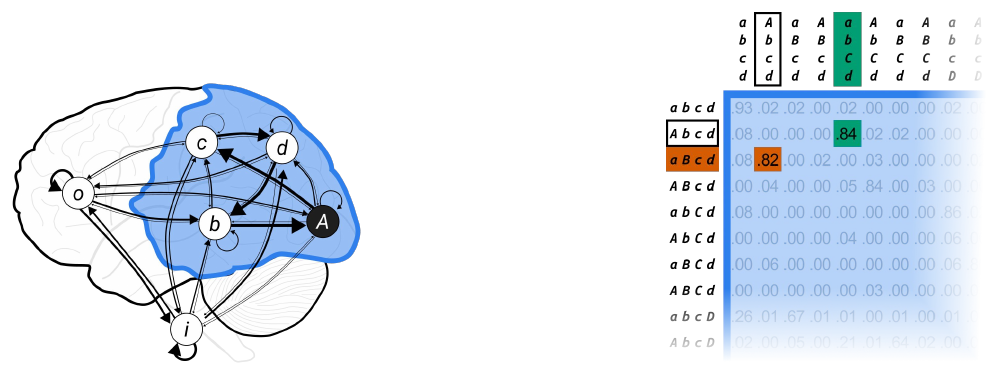
[The six units are placed on an outline of the brain. The complex A, B, C and D lies in a region shaded blue and outlined in solid blue over the back of the cortex, with arrows among its units; O and I lie outside it, towards the front and underside of the brain. On the right is the top-left part of the complex's TPM, with the current state Abcd boxed, the cause state marked in orange (.82) and the effect state in green (.84). On slide 6 the same complex is shown on the hexagonal substrate graph instead of the brain.]
From two dimensions to three (slides 9–12)
As a visual aid, we can think of the substrate graph and TPM as being 2D representations of cause–effect power.
Now, when we unfold the cause–effect power in full, we can imagine we are shifting from a 2D to a 3D view.
Hence, we'll now depict the substrate graph and TPM as "flat," and aim to show how the system's cause–effect structure (or Φ-structure) can be unfolded from these 2D representations.
A Φ-structure is made up of causal distinctions and the relations that bind them together.
[On slides 9 and 10, callout boxes carry the first two sentences, while the brain and the TPM tilt backwards until they lie flat, as though seen in perspective. On slides 11 and 12, the Φ-structure, labelled "Φ-structure," rises above the flattened brain, as in the title image; the flattened TPM remains at lower right.]
The elements of a distinction (slides 13–17)
First, we will look at distinctions.
A distinction comprises three elements: a mechanism, cause purview, and effect purview.
Given that our system is in state Abcd, we can consider any subset of the powerset of Abcd to be a candidate mechanism.
Since the cause state of our system is aBcd, any subset from this powerset can be a candidate cause purview.
Similarly, since the effect state is abCd, any of its subsets can be a candidate effect purview.
Visually, we can think of creating a distinction as combining one of the elements from each of these bubbles (though mathematically, it's a bit more complicated).
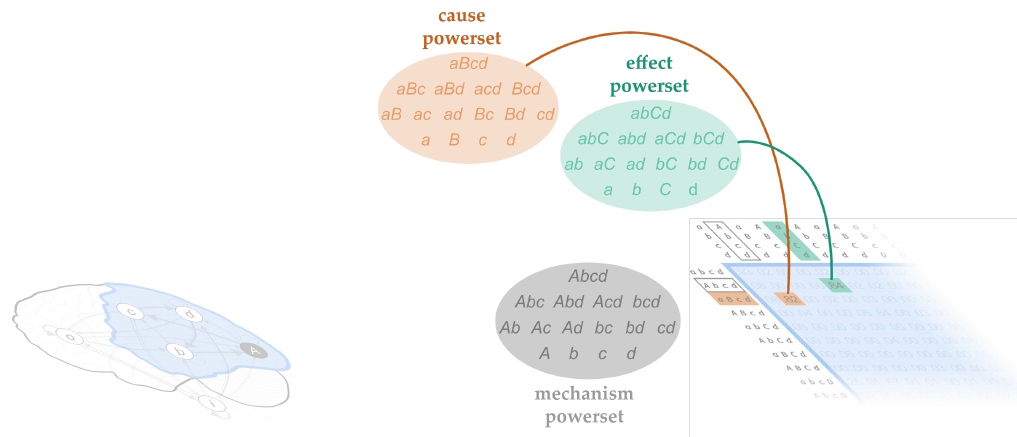
[Three ovals list every subset of a state, arranged in rows by size. The grey "mechanism powerset" lists the subsets of the current state: Abcd; Abc, Abd, Acd, bcd; Ab, Ac, Ad, bc, bd, cd; A, b, c, d. The orange "cause powerset" lists the subsets of the cause state: aBcd; aBc, aBd, acd, Bcd; aB, ac, ad, Bc, Bd, cd; a, B, c, d. The green "effect powerset" lists the subsets of the effect state: abCd; abC, abd, aCd, bCd; ab, aC, ad, bC, bd, Cd; a, b, C, d. Curved orange and green arrows lead from the cause and effect powersets to the cause and effect entries in the flattened TPM at lower right. In the text, "mechanism" is printed in grey, "cause purview" in orange and "effect purview" in green.]
Three example distinctions (slides 18–24)
For example, here we see 1st-order distinction c, comprising mechanism c, cause a, and effect d.
This same distinction is depicted in the Φ-structure, with the distinction "planted" on the substrate through its mechanism—unit c.
We can do the same for a 2nd-order distinction—for example, mechanism cd, cause a, and effect ad.
And here is this 2nd-order distinction. Yet unlike the 1st-order one, we cannot plant it on the substrate directly—rather, higher-order mechanisms and purviews are simply depicted higher up on the Φ-structure.
We can also depict a 3rd-order distinction—comprising mechanism bcd, cause ac, and effect abd.
And again, this 3rd-order distinction appears even higher up on the Φ-structure.
Here we have simply depicted three distinctions without explaining how we got them. In practice, each possible combination of mechanism, cause, and effect has to be evaluated as a candidate distinction.
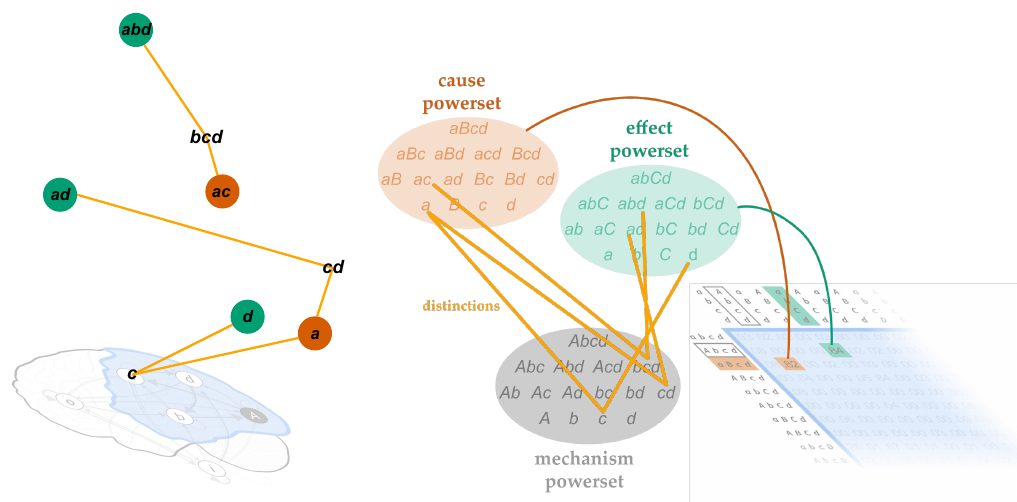
[On the left, above the faded brain, the three distinctions are drawn as orange lines joining an orange cause circle and a green effect circle through a mechanism label. The 1st-order distinction is planted on unit C of the brain and joins cause a and effect d. Higher up, the 2nd-order mechanism cd joins cause a and effect ad. Higher still, the 3rd-order mechanism bcd joins cause ac and effect abd. On the right, orange lines labelled "distinctions" connect the same elements in the three powersets: c, cd and bcd in the mechanism powerset to a and ac in the cause powerset and to d, ad and abd in the effect powerset.]
Finding the proper distinctions (slide 25)
The technical details are here. But in short, we assess the irreducibility of each candidate by measuring its φd value, and we check whether it is congruent with the system (i.e., the state of its purview units must match the system's cause–effect state, aBcd–abCd). Only the candidates that are maximally irreducible and congruent are proper distinctions.
The seven distinctions of this system (slides 26–30)
This system happens to have 7 distinctions, depicted below.
In the powersets, we see that only the subsets in bold take part in forming the distinctions (the grayed out candidates are all reducible).
Each irreducible mechanism must specify a distinction—here, 7 in total.
But there needn't be 7 subsets in each purview powerset. Here, for example, there are only 5 among the cause purviews because some distinctions specify the same purviews.
Here is a simpler depiction of each distinction, together with its associated value of φd (distinction "small phi"). They have a cumulative φd of 3.21 (which we will use later).
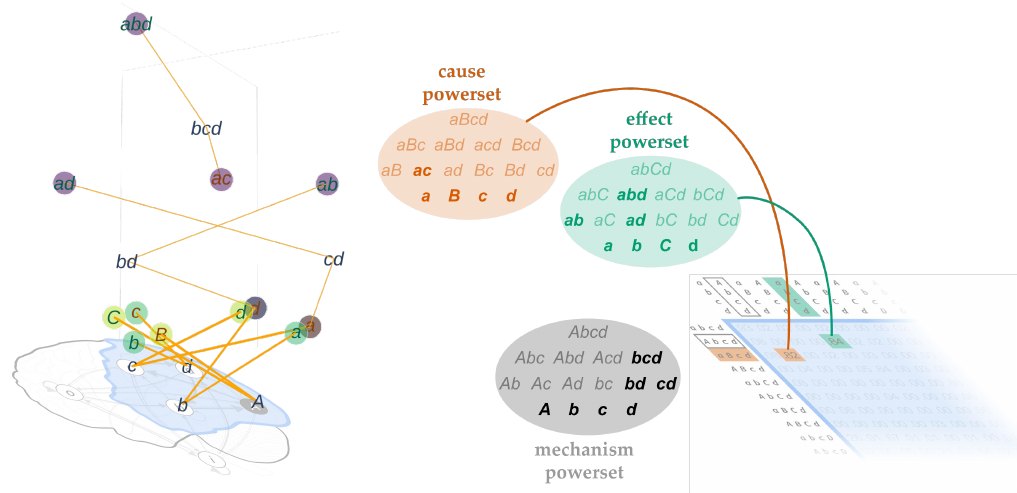
[On the left, all seven distinctions are drawn above the faded brain as orange lines between causes and effects: four 1st-order distinctions planted on the units, and higher-order ones labelled bd, cd and bcd higher up. On the right, the subsets that take part in a distinction are printed in bold in the powersets and the rest are greyed out. In the mechanism powerset they are A, b, c, d, bd, cd and bcd (seven); in the cause powerset, a, B, c, d and ac (five); in the effect powerset, a, b, C, d, ab, ad and abd. On slides 28 and 29, callout boxes carry the two sentences about the number of mechanisms and cause purviews.]
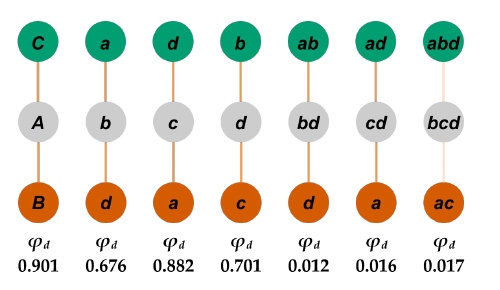
[The seven distinctions are shown as seven vertical columns, each a green circle (effect) above a grey circle (mechanism) above an orange circle (cause), joined by orange links, with the φd value beneath:
| mechanism | cause | effect | φd |
|---|---|---|---|
| A | B | C | 0.901 |
| b | d | a | 0.676 |
| c | a | d | 0.882 |
| d | c | b | 0.701 |
| bd | d | ab | 0.012 |
| cd | a | ad | 0.016 |
| bcd | ac | abd | 0.017 |
The links of the three higher-order distinctions are paler, matching their small φd values. The values sum to 3.21.]
Relations: the example of c and bcd (slides 31–40)
With all distinctions on the table, the next step of unfolding is to determine the way distinctions are related by overlapping over causes and/or effects.
This shows all of the relations among these distinctions. Let's see how we get these one by one.
We'll focus on the relation between distinctions c and bcd.
Note that these two distinctions are related because they overlap over purview units a and d in their causes and effects, not because they share mechanism unit c.
This is called a 2nd-degree relation (or 2-relation) because it involves two distinctions.
This relation has four faces—each corresponding to a distinct overlap of causes and/or effects:
- three 2nd-degree faces (the blue lines connecting a–ac, a–abd, & d–abd)
- one 3rd-degree face (shaded blue triangle connecting ac–a–abd)
Underlined units indicate the face overlap.
Why isn't there a 2-relation between a and a here? There is, but it is not part of the 2-relation we are describing. It is rather part of the 1-relation involving distinction bcd alone
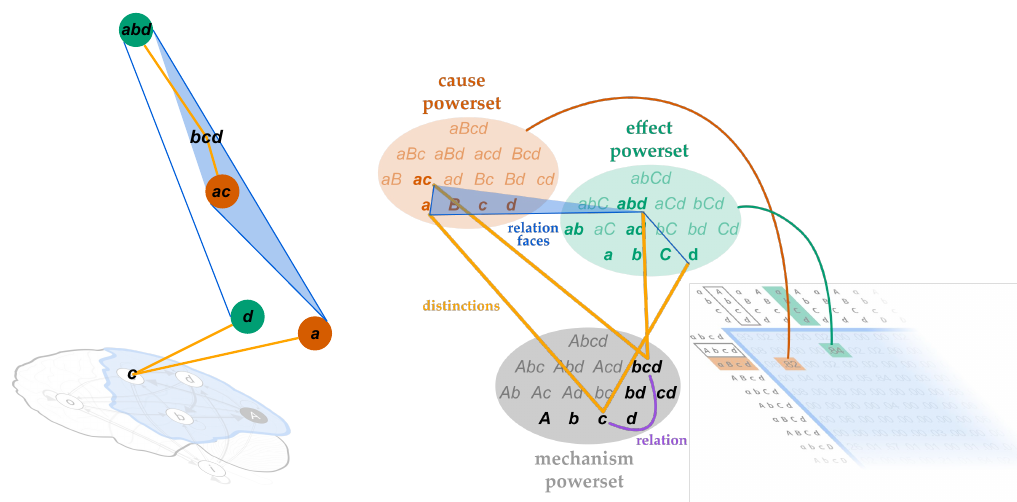
[On the left, distinction c (planted on unit C, cause a, effect d) and distinction bcd (cause ac, effect abd) are joined by blue lines connecting a to ac, a to abd, and d to abd, and by a shaded blue triangle connecting ac, a and abd. On the right, in the powersets, a purple outline labelled "relation" encloses c and bcd in the mechanism powerset, and a blue band labelled "relation faces" joins the overlapping purviews in the cause and effect powersets. In the bulleted text, the units in each face that overlap are underlined. On slide 32, the full set of relations is shown as the translucent polyhedron of the title image; on slides 33 and 34, callout boxes carry the sentences about focusing on c and bcd and about why they are related; on slide 40, a callout box carries the question about a and a.]
Measuring relations (slides 41–43)
Like for distinctions, each relation also has a corresponding value of φr (relation "small phi").
φr quantifies the irreducibility of the relation: it measures to what extent a set of distinctions are bound together by virtue of having overlapping causes and/or effects. For the relation of c and bcd, the φr is 0.008 (mathematical details here).
By assessing all purview overlaps in this way, we reveal the relations—31 for this system, with a total φr of 0.93.
The complete Φ-structure (slides 44–49)
In summary, the 7 distinctions and 31 relations are all the elements needed to assemble the complete Φ-structure (or cause–effect structure) of this system.
The distinctions are depicted with the first-order mechanisms "planted" on their respective substrate units. Each links a cause and an effect. The φd values are indicated by the thickness of the links and by the color of the bubbles (cool to warm tracks low to high φ).
And the relations are depicted as faces connecting the purviews. Second-degree faces are edges, and third-degree faces are surfaces. (We cannot show higher-degree faces, though there are many.) The φr values are indicated by the thickness and opacity of the edges and surfaces.
Now that we have unfolded the Φ-structure in full, we can calculate its Φ ("big Phi") value, which is simply the sum of φd and φr: Φ = φd + φr = 3.21 + 0.93 = 4.14.
Note that this is just one way to depict a Φ-structure, in which the powersets of mechanisms and purviews are arranged by order in layers of regular polygons. Though this view may appear chaotic at times, it allows you to see which subsets in the powerset are absent (and thus reducible). We will use other depictions in, for example, the sections on space and time.
To play with an interactive version of this Φ-structure, click here.
[These slides show the Φ-structure of the title image without the powersets. On slide 45 only the distinctions are drawn, as orange links between causes and effects, with the mechanism and purview labels arranged in layers by order above the brain. From slide 46 the relations are added as blue-grey edges and translucent surfaces, forming the polyhedron. From slide 47 it is labelled "Φ(Abcd) = 4.14." In the text, "cause" is printed in orange, "effect" in green, "links" in yellow-orange and "faces" in blue. On slide 49, a callout box carries the link to the interactive version.]
Summary slide (slide 50)
[The closing slide, labelled "summary," pairs the axiom and postulate from slide 5, with the photograph overlaid with yellow outlines, with the diagram from slide 1: the Φ-structure with Φ(Abcd) = 4.14 and the three powersets linked by distinctions and relations.]