Corpus
Sleep/wake changes in perturbational complexity in rats and mice
Summary
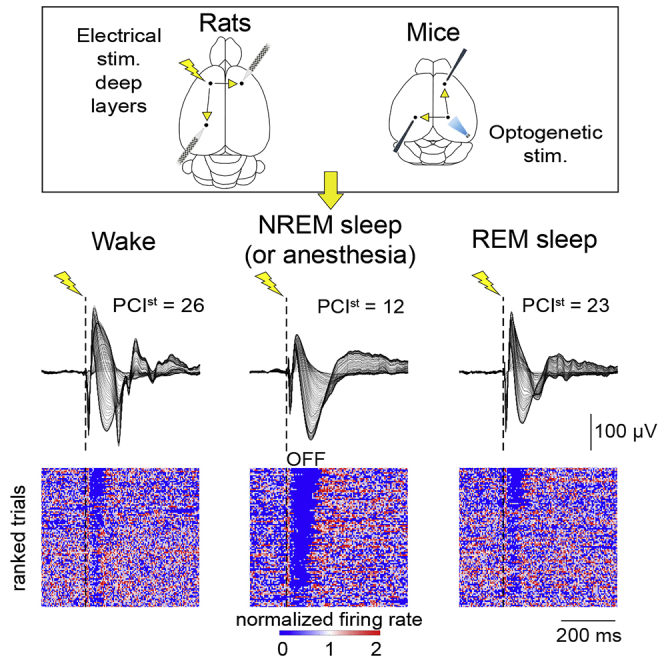
In humans, the level of consciousness is assessed by quantifying the spatiotemporal complexity of cortical responses using Perturbational Complexity Index (PCI) and related PCIst (st, state transitions). Here we validate PCIst in freely moving rats and mice by showing that it is lower in NREM sleep and slow wave anesthesia than in wake or REM sleep, as in humans. We then show that (1) low PCIst is associated with the occurrence of an OFF period of neuronal silence; (2) stimulation of deep, but not superficial, cortical layers leads to reliable PCIst changes across sleep/wake and anesthesia; (3) consistent PCIst changes are independent of which single area is being stimulated or recorded, except for recordings in mouse prefrontal cortex. These experiments show that PCIst can reliably measure vigilance states in unresponsive animals and support the hypothesis that it is low when an OFF period disrupts causal interactions in cortical networks.
Subject areas: Natural sciences, Biological sciences, Neuroscience
Graphical abstract
Highlights
- PCIst is high in wake and REM sleep and low in NREM sleep in rodents as in humans
- Low PCIst values in NREM sleep are associated with an OFF period of neuronal silence
- Reliable sleep/wake changes in PCIst occur after stimulation in deep cortical layers
- PCIst can assess the level of vigilance states in unresponsive animals
Natural sciences; Biological sciences; Neuroscience
Introduction
The Perturbational Complexity Index (PCI ) was developed in humans as a tool to quantify the complexity of the cortical event related potentials (ERPs) triggered by transcranial magnetic stimulation (TMS).[1] The underlying rationale was provided by the integrated information theory of consciousness, according to which high complexity, resulting from the combined presence of high integration and high information in corticothalamic networks, is a prerequisite for being conscious.[2],[3],[4] In agreement with the theory, during wake, REM sleep, and ketamine anesthesia, when subjects retrospectively report vivid experiences, PCI is high because the stimulation triggers complex responses that are long-lasting and spread across many cortical regions. By contrast, during slow wave sleep and deep slow wave anesthesia, when subjects retrospectively report that they were not conscious, PCI is low because the response to stimulation either remains local, indicative of low integration, or is global but stereotyped, reflecting low differentiation.[1] The analysis of PCI data from a benchmark population of 150 subjects in whom the presence or loss of consciousness could be established unequivocally led to the identification of an empirical PCI cutoff that, in healthysubjects, could discriminate between conscious and unconscious conditions with nearly 100% sensitivity and specificity.[1] These results prompted the use of PCI to gauge the level of consciousness in patients in vegetative state (unresponsive wakefulness syndrome) and other difficult clinical situations where patients are either unresponsive or minimally responsive.[5] Recently, another method to determine the complexity of the ERP was introduced, called PCIst, which calculates the overall number of non-redundant “state transitions” (st) caused by the stimulation.[6] PCIst has been validated using TMS and then extended to cases in which the cortical response was measured after deep intracranial electrical stimulation. It was found that PCIst is nearly as accurate as PCI but easier and faster to compute, hence more suitable in clinical settings.[6]
Although PCI and PCIst are recognized as sensitive and specific measures to assess consciousness,7 the underlying cellular and network mechanisms are largely unexplored. In NREM sleep and slow wave anesthesia, when PCI/PCIst values are low, cortical neurons are not tonically active but alternate more or less synchronously between ON periods of firing and OFF periods of silence.[8] It has been hypothesized that, under such conditions, cortical networks may be “bistable,” that is, they may not be able to support sustained causal interactions but, after brief periods of activity, necessarily fall into periods of silence. Under a bistable regime, strong stimuli are likely to silence the cortical network by triggering a large OFF period, thereby impairing causal interactions among cortical areas and resulting in a simple evoked response and low values of PCI/PCIst 7,9. So far, however, studies in humans[9] and a recent study in anesthetized rats[10] could not provide direct evidence for the cessation of cortical unit firing underlying bistability.
In this study, we investigate PCIst responses in freely-moving rodents—both rats and mice—using electrical and optogenetic stimulation accompanied by unit recording probes with multiple contacts (Neuropixels and NeuroNexus probes). We first demonstrate that PCIstreveal changes in the complexity of neuronal responses with behavioral state—wake, NREM sleep, REM sleep, as well as anesthesia - that are similar to those observed in humans. Thus, PCIst can serve as a reliable indicator of consciousness in laboratory animals, one that is highly validated in humans and that, unlike the standard righting reflex, can be employed in unresponsive states. We show that PCIst changes can be recorded from a single site of penetration across multiple contacts, without the need to record from separate areas. We also show that the reduction of PCIst is associated with the triggering of neuronal OFF periods. We further investigate how different cortical areas and layers are involved in triggering and expressing complex neural responses and how, within each behavioral state, baseline activity can modulate the evoked response.
Results
Analysis of PCIst in rats using electrical stimulation
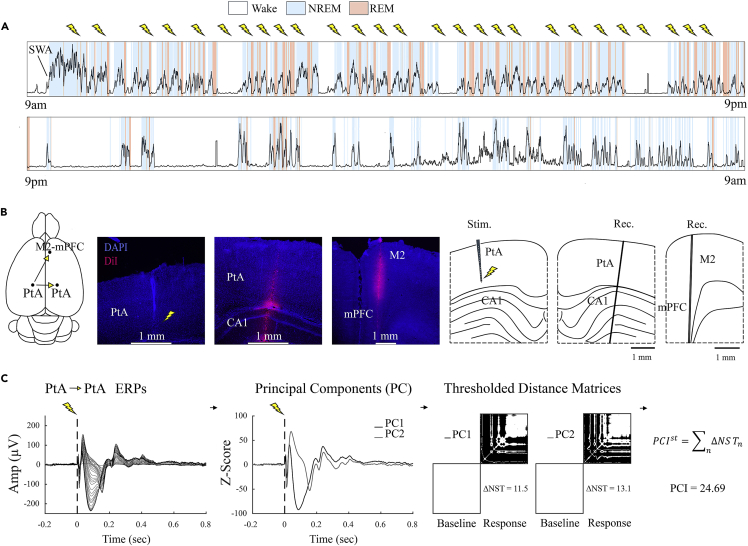
PCIst measurements started only after the sleep/waking pattern had normalized, usually at least one week after surgery. As expected because rats are nocturnal, animals spent most of the light period asleep and were mainly awake at night (Figure 1A). Electrical stimuli were delivered only during the light period and trials occurred across several days to limit the number of stimuli delivered each day (Figure 1A; ∼100 in each of the behavioral states: waking, NREM sleep, REM sleep). PCIst was measured after electrical stimulation delivered by a laminar probe implanted perpendicular to the cortical surface, and recording was performed using one high-density Neuropixels probe (Figure 1B). As in humans,6 PCIst was derived from the averaged (across all trials) ERP for each of the cortical channels (∼80–100 channels in each rat), first by identifying the principal components that accounted for at least 99% of the response strength to the stimulation and then by calculating, for each component, the number of state transitions in the evoked response relative to the pre-stimulus baseline (Figure 1C). Unlike in humans, however, all channels came from the same area (e.g., parietal association cortex, PtA). In almost all cases the electrodes spanned all layers of a given area, with the exception of the prefrontal cortex in which recordings came mainly from the deep layers.
Experimental design
(A) Distribution of wake, NREM sleep and REM sleep during a continuous 24-h recording in a representative rat. The black line shows slow wave activity (SWA, a. u.). As expected, SWA (the power in the 0.5–4 Hz range in cortical local field potentials) is elevated during NREM sleep and peaks at the beginning of the light period, the major sleep phase. Electrical stimuli (lightning bolts) were delivered during the light phase only.
(B) Schematic of the rat brain displaying the position of the electrodes and coronal sections showing the location of stimulating and recording probes in one representative rat.
(C) Left, averaged (across all trials) event related potentials (ERPs) for all cortical channels, each channel re-referenced to the white matter. To calculate PCIst, the ERPs for each cortical channel (81 channels in this example) are averaged across all trials (n=100 trials) and decomposed to identify the principal components (PC) of the ERPs. The “up and down” of each PC (state transitions, ST) are calculated after thresholding and compared between post- and pre-stimulation (distance matrix). PCIst is the sum of the post/pre differences in ST (ΔNST) for all PCs (see STAR Methods for details). In this and the following figures, the first (PtA in this example) and second (PtA in this example) cortical area indicate the site of stimulation and recording, respectively.
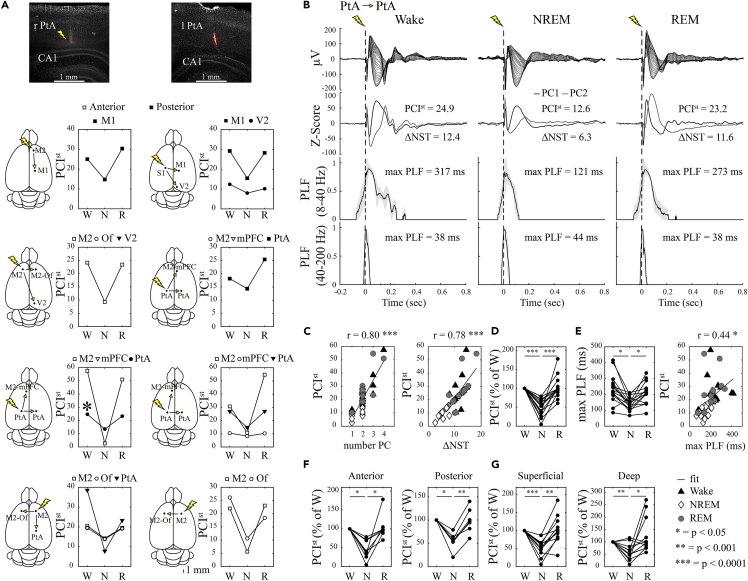
In the first set of experiments electrical stimuli were always delivered to the deep layers, and the cortical areas targeted for stimulation and recording varied across animals (Figure 2A). In most cases, independent of the location of the stimulating and recording electrodes, rats (n = 8) showed more complex responses in wake and in REM sleep than in NREM sleep (Figure 2B), leading to high PCIstvalues in wake, low in NREM sleep, and intermediate or high in REM sleep in one or more of the recorded areas (Figure 2A). In a few cases in which the recording electrode was contralateral and distant from the stimulating electrode (e.g. left M2 and right V2; left PtA and right M2) the evoked response was minimal or absent in one or more vigilance states, precluding PCIstanalysis or resulting in inconsistent changes across states (Figure 2A). The number of principal components of the ERPs ranged from 1 to 4; most often there were 2 and the number did not change across behavioral states. Thus, changes in PCIstwere driven mostly by changes in the number of state transitions (Figures 2B and 2C). PCIstvalues in NREM sleep decreased on average by 50 ± 20% relative to wake and by 51 ± 27% compared to REM sleep, resulting in significant changes at the group level (paired ANOVA; F(1.69, 23.7) = 33.4; p < 0.0001; ƞ2 = 0.70; Figure 2D; Tukey’s correction for multiple comparison on Figure 2D). The Phase Locking Factor (PLF), which measures for how long the evoked response remains phased locked to the original stimulus, was calculated for each recording site in wake and sleep. PLF was measured in the 8–40 Hz range because higher frequencies (40-200 Hz) did not discriminate across behavioral states (Figure 2B), consistent with the results in humans.[9] We found long PLF in wake and REM sleep and short PLF in NREM sleep (F(1.80, 25.2) = 13.05; p = 0.0002; ƞ2 = 0.48) and PCIst and PLF values were positively correlated (Figure 2E). Grouping the recording sites in more anterior (M2, mPFC, Of) and more posterior (M1, PtA, V2) sites did not reveal any major difference, that is, significant sleep/wake differences in PCIstcould be detected in all areas (Figure 2F; Frontal: F(1.48, 10.4) = 14.84; p = 0.0015; ƞ2 = 0.67; Posterior: F(1.38, 8.32) = 23.11; p = 0.0007; ƞ2 = 0.79). To assess the contribution of superficial and deep layers, for each recording site PCIstwas also calculated separately for the channels in the upper and lower half of the laminar probe. In general, both superficial and deep channels contributed to the sleep/wake changes (Figure 2G; superficial: F(1.58, 17.4) = 17.02; p = 0.0001; ƞ2 = 0.62; deep: F(1.24, 13.6) = 6.47; p = 0.019; ƞ2 = 0.37).
Sleep/wake changes in PCIst in rat cortex
(A) Histology in a representative rat and schematic location of stimulating and recording electrodes in each animal, with corresponding PCIst values in wake (W), NREM sleep (N) and REM sleep (R). Empty and filled symbols indicate more anterior and more posterior regions, respectively, where PCIst was measured. The cases (n = 5) in which ERPs were absent in wake are not included. M1, primary motor; M2, secondary motor; mPFC, medial prefrontal; Of, orbitofrontal; PtA, parietal association; V2, secondary visual.
(B) Example of ERPs, their principal components (PC), and phase locking factor (PLF) for one rat (PtA, ∗ in panel A). PLF is shown separately for the 8–40 Hz range and the 40–200 Hz range. The latter was not used in the main analysis because it does not discriminate across behavioral states.
(C) Number of PC (left) and changes in the number state transitions ((ΔNST, right) for all experiments. Note that in most experiments PC = 2, independent of sleep and wake.
(D) Group level changes in PCIst across waking and sleep.
(E) Group level changes in max PLF across waking and sleep and correlation with PCIst.
(F and G) Group level changes in PCIst across wake and sleep shown separately for recording in anterior and posterior cortical regions, and for superficial and deep channels.
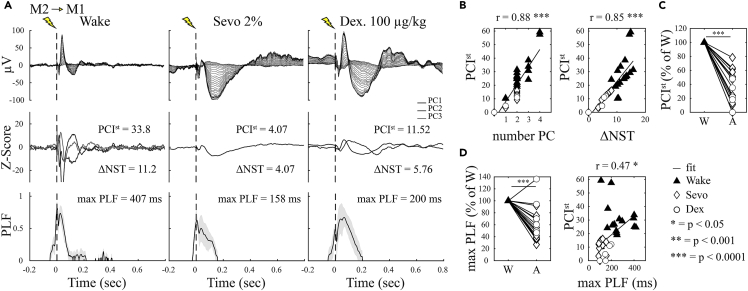
In 8 rats PCIst was also compared between wake and deep anesthesia, with loss of righting reflex, induced using sevoflurane (2%; 14 areas) or dexmedetomidine (100μg/kg; 6 areas) (Figure 3A). In all cases, independent of the location of stimulating and recording electrodes, PCIst was lower under anesthesia compared to waking and the difference was mainly driven by changes in the number of state transitions (Figures 3B and 3C). In most cases PLF values were lower under anesthesia and were positively correlated with PCIst values (Figure 3D). PCIst values in anesthesia did not differ significantly from those during NREM sleep (W, NREM, A; F (1.74, 27.9) = 66.7; p < 0.0001; ƞ2 = 0.81; NREM vs A, p = 0.1267).
Anesthesia-induced changes in PCIst in rat cortex
(A) Example of ERPs (top), their principal components (PC, middle), and phase locking factor (PLF, bottom) for one representative rat.
(B) Number of PC (left) and changes in the number of state transitions ((ΔNST, right) for all experiments.
(C) Group level changes in PCIst between wake and anesthesia. Cases in which ERPs were absent in wake are not included (n = 5).
(D) Group level changes in max PLF between wake and anesthesia and correlation with PCIst.
In 4 rats the stimulation was delivered at different depths spanning superficial and deep layers, and the response was measured across all layers (Figures 4A and 4B). ERPs in both ipsilateral and contralateral cortex were large when deep layers were stimulated and small or undetectable when the stimulation was restricted to the most superficial layers (Figures 4C and 4D). As a result, in both ipsilateral and contralateral cortex the sleep/wake changes in PCIst were robust for stimulation of deep and middle layers, but inconsistent when only the most superficial layers were stimulated (Figures 4E and 4F).
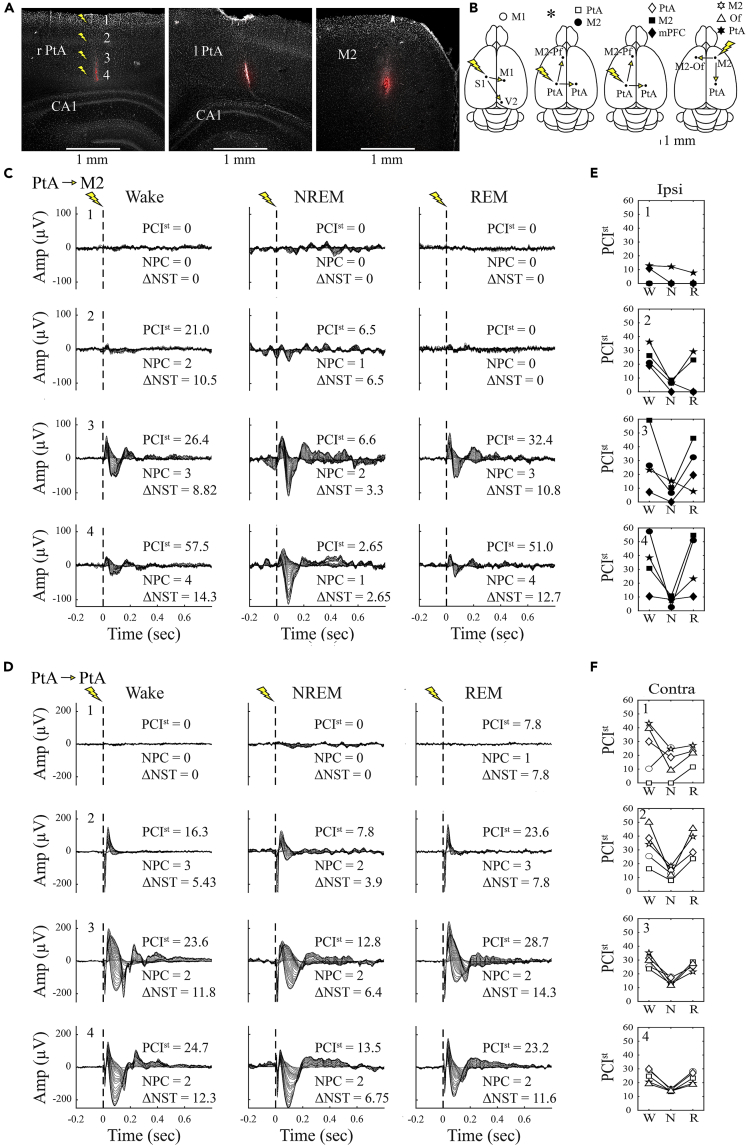
Changes in PCIstdepending on the depth of stimulation
(A) Histology in a representative rat.
(B) Schematic location of stimulating and recording electrodes in the 4 rats used for depth analysis.
(C) Example of ERPs and PCIst values after stimulation in PtA at 4 different depths and recording in ipsilateral M2 in one rat (asterisk in panel B).
(D) Eexample of ERPs and PCIst values after stimulation in PtA at 4 different depths and recording in contralateral PtA in one rat (asterisk in panel B).
(E and F) Sleep/wake changes in PCIst for all 4 rats, shown separately depending on depth of stimulation. The different symbols refer to the areas indicated in panel B, with filled and open symbols indicating ipsilateral and contralateral stimulation, respectively.
To test whether electrical stimulation triggers an OFF period, Neuropixels recordings were spike-sorted using the Kilosort2.5 algorithm,11 followed by manual curation (see STAR Methods). We focused on 6 rats that had a good yield of cortical units (67 ± 42 single units, 38 ± 31 MUA per cortical area, mean ± std dev) and in which electrical stimulation produced robust ERPs in all 3 states, resulting in reliable changes in PCIst. For each rat and each area separately, we first analyzed sleep in baseline and after 6 h of sleep deprivation, without electrical stimulation, to define the range in the duration of the OFF periods. From the peri-slow-wave time histograms corresponding to all areas (Figure 5A) we obtained an average duration of OFF periods of 48 ± 14 ms (mean ± std dev; range 35–68 ms) during baseline sleep and of 97 ± 37 ms (range 48–152 ms) during the first 2 h of recovery sleep after sleep deprivation. We then tested whether the electrical stimulation triggered a bona fide OFF period, as defined based on the analysis in sleep, and calculated its average duration for each experimental condition (wake, NREM sleep, REM sleep). In 5 out of 6 rats periods of neuronal silence (62 ± 27 msec, mean ± std dev) were induced during NREM sleep (Figure 5A) and their amplitude and laminar distribution were very similar to those of the spontaneous OFF periods (Figure 5B). This pattern applied to all areas examined (M1, M2, Of, PtA). OFF periods were induced less frequently in wake and REM sleep as compared to NREM sleep. Specifically, “effectiveness”, defined as the percentage of trials per animal with evoked OFF periods of at least 30 ms, was 48 ± 45% in wake, 81 ± 21% in NREM sleep, and 48 ± 42% in REM sleep (F(1.06, 8.49) = 9.87, p = 0.012; ƞ2 = 0.55; Wake vs REM p > 0.05). Even when present, the average duration of the evoked OFF periods was shorter in wake and REM sleep as compared to NREM sleep (Figure 5A; eOFF: Wake 17 ± 25 msec, NREM 42 ± 37 msec, REM 12 ± 24 msec; F(1.07, 8.57) = 8.35, p = 0.017, ƞ2 = 0.51; Wake vs REM p > 0.05). Similar results were obtained when evoked OFF periods were measured at the single trial level (Wake 39 ± 41 msec, NREM 80 ± 37 msec, REM 37 ± 38 msec; F(1.15, 9.19) = 37.68, p = 0.0001; ƞ2 = 0.82; Wake vs REM p > 0.05). Finally, when present in wake and REM sleep, the occasional OFF periods were followed by a rebound in firing that exceeded the pre-stimulation levels of spiking, which was not the case for the OFF periods evoked in NREM sleep. In two rats in whichOFF periods were present in all three behavioral states (albeit longer in NREM sleep), the rebound firing was still present only in wake and REM sleep (Figure 5A). In a few cases no clear OFF periods in NREM sleep were observed in the peri-stimulus time histogram, but the mean firing rate still showed a decline after the electrical stimulation, whereas no clear decrease in unit activity occurred in wake and REM sleep. In summary, OFF periods occur in most cases after stimulation during NREM sleep. OFF periods are less likely to be induced in wake and REM sleep and when they occur, they are shorter and, unlike those in NREM sleep, usually followed by a strong rebound in unit firing. Finally, in a few animals with high yield of both cortical and thalamic units the single-unit peri-stimulus time histogram showed that electrical stimulation during NREM sleep triggered a period of strongly reduced activity in both cortex and thalamus. Notably, however, the thalamic OFF period was shorter, leading to an earlier rebound of firing in thalamus than in cortex, a pattern also seen during physiological NREM sleep (Figure 5C). In wake and REM sleep the thalamic OFF period was shorter than in NREM sleep and was not followed by a clear rebound in firing.
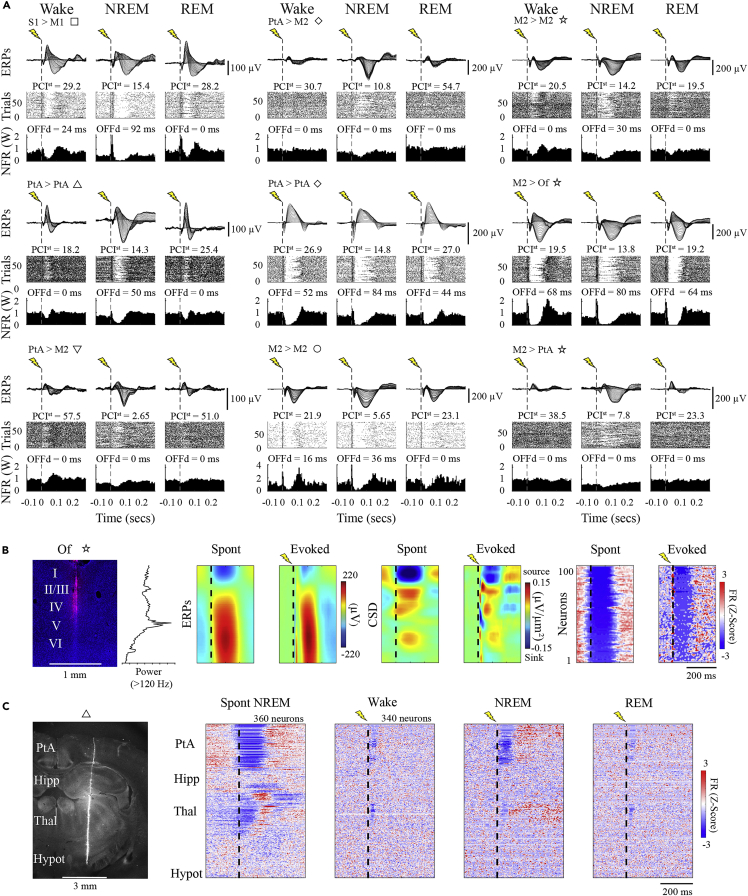
OFF periods triggered by electrical stimulation in rats
(A) Nine examples of ERPs in 6 rats (top), corresponding changes in firing rate across all trials (middle) and mean changes in firing rate (normalized to the wake values, NFR). In each example, the first and second cortical area indicate the site of stimulation and recording, respectively, followed by a symbol that identifies the specific animal. OFFd, duration of the evoked OFF period.
(B) Example of the comparison between spontaneous slow waves (n =1662, detected during recovery sleep) and evoked slow waves (n = 94) in one site (orbitofrontal cortex, Of), showing similar amplitude, laminar distribution (CSD, current source density) and unit activity (FR, firing rate). Here and in C, time zero (vertical dashed line) represents slow-wave zero crossing (spont) and electrical stimulation (evoked). The electrode location was estimated using histological reconstruction of the electrode track (left panels) and based on the peak in gamma (>120Hz) power, which is a reliable marker of layer 5 in rodent cortex.[12],[13]
(C) Example of single-unit peri-stimulus time histograms (PSTH) locked to the slow wave zero-crossing (n =1025, detected during recovery sleep) or the electrical stimulation in wake, NREM sleep and REM sleep (80 pulses per state) in a parietal probe (PtA), sorted by depth. Each row corresponds to the PSTH of a single unit. For each single unit, evoked rates were zscore-normalized based on the mean and standard deviation of instantaneous evoked rates across bins from −2s to −10msec before the pulses. Region boundaries were obtained from histological reconstruction (left panel); Cx, cortex; Hipp, hippocampus; Th, thalamus; Hypot, hypothalamus.
Analysis of PCIst in mice using optogenetic stimulation
Cortical stimuli were delivered at least 1–2 weeks after surgery to allow the sleep/wake pattern to normalize. Mice, like rats, were asleep mainly during the day and had several hours of spontaneous wake at night, and stimuli were delivered only during the light phase (Figure 6A). In CaMKIIα:ChR2 mice the excitatory opsin is expressed in the pyramidal neurons of the cortex and hippocampus.[14] For the stimulation of the posterior parietal association area (PtA), the optic fibers were placed on the cortical surface to avoid the stimulation of the hippocampus. For anterior stimulation, optic fibers were implanted deep in prefrontal cortex to target as much as possible all layers (Figure 6B). ERPs recorded from PtA and other areas outside the prefrontal cortex (V2, S1) showed a pattern consistent with the one seen in rats: responses were complex in wake and REM sleep and tended to be larger but more stereotyped in NREM sleep (Figure 6C). This pattern occurred independent of the stimulated area (PtA or prefrontal cortex) and resulted in PCIst values that were higher in wake than in NREM sleep, and almost always higher in REM sleep than in NREM sleep (Figures 6D and 6G; F(1.35, 8.14) = 6.23; p = 0.0302; ƞ2 = 0.51). By contrast, ERPs recorded from frontal and prefrontal cortex were either small or stereotyped across states (Figure 6E), and led to PCIst values that did not differ significantly across states but were higher in NREM sleep than in wake (Figures 6D and 6G; F(1.08, 3.24) = 2.21; p = 0.2298; ƞ2 = 0.42).
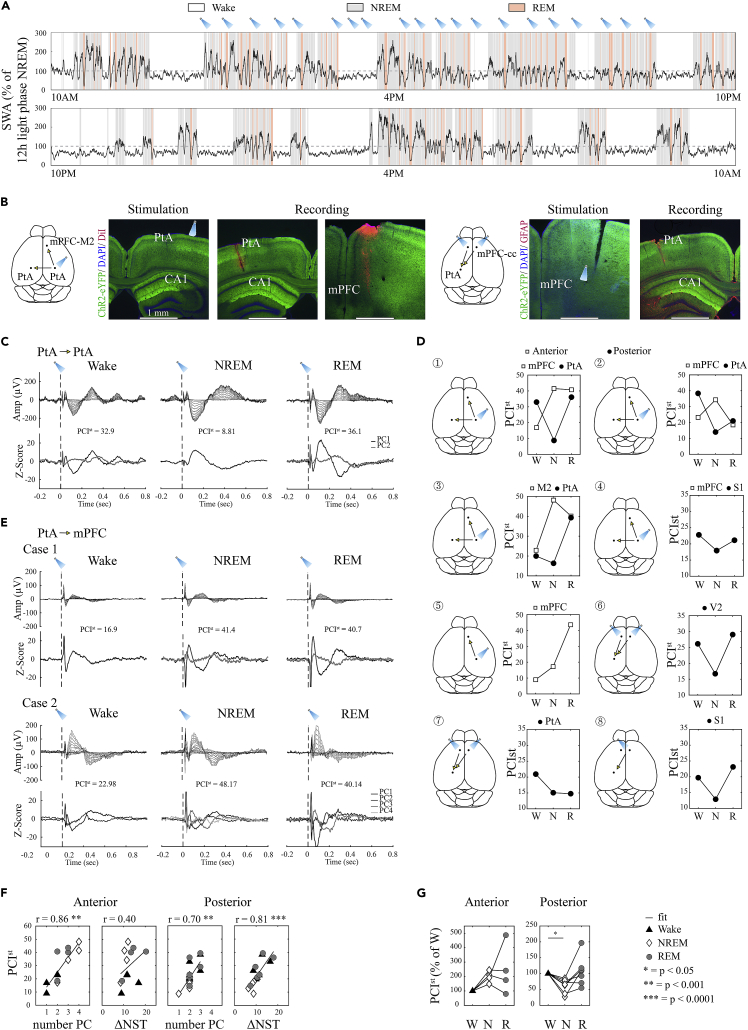
Sleep/wake changes in PCIst in mouse cortex
(A) Distribution of wake, NREM sleep and REM sleep during a continuous 24-h recording in a representative mouse. The black line shows relative slow wave activity (SWA), which as in rats peaks at the beginning of the light period, Optogenetic stimuli were delivered during the light phase only.
(B) Schematic of the mouse brain displaying the position of the electrodes and coronal sections showing the location of stimulating and recording sites in two mice with stimulation in frontal or posterior cortex. DAPI and GFAP (glial fibrillary acidic protein) staining were used to identify cortical layers and probes, respectively.
(C and E) Examples of ERPs (top) and their principal components (PCs, bottom) for 3 mice.
(D) Schematic location of stimulating and recording electrodes in each animal, with corresponding PCIst values in wake (W), NREM sleep (N) and REM sleep (R). Empty and filled symbols indicate more anterior and more posterior regions, respectively, where the recording electrode was located. Cases in which ERPs were absent in wake are not included (n = 5). S1, primary sensory; M2, secondary motor; mPFC, medial prefrontal; PtA, parietal association; V2, secondary visual.
(F) Number of PCs and changes in the number of state transitions for all experiments, shown separately for anterior and posterior regions.
(G) Group level sleep/wake changes in PCIst recorded in anterior and posterior regions.
In 9 mice PCIst was also measured in deep anesthesia (sevoflurane, 1-2%; dexmedetomidine 70–100 μg/kg) (Figures 7A–7C). ERPs recorded from PtA and other posterior areas showed complex responses in wake and more stereotyped responses in anesthesia, whereas ERPs recorded from frontal and prefrontal cortex were often small or stereotyped in all cases (Figures 7A and 7B). PCIst values recorded in posterior areas were always lower in anesthesia than in wake, whereas in anterior areas they were inconsistent (Figure 7D).
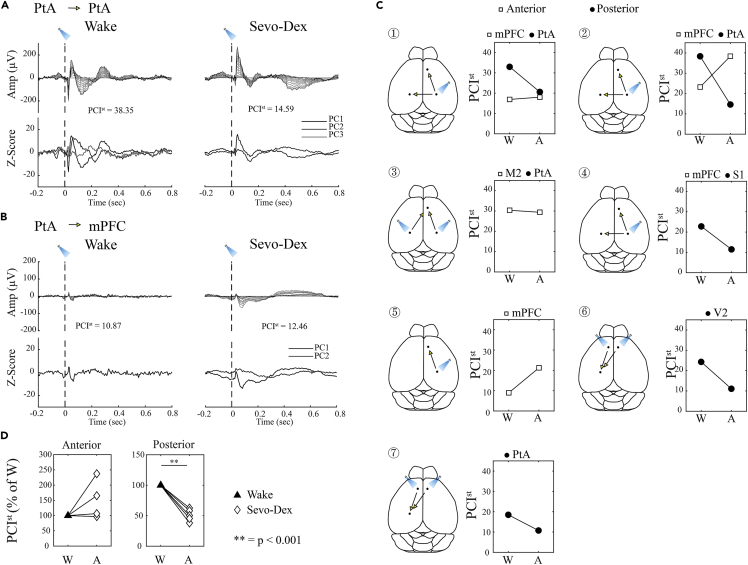
Anesthesia-induced changes in PCIst in mouse cortex
(A and B) Example of ERPs and their principal components (PC) for two mice.
(C) Schematic location of stimulating and recording electrodes in each animal, with corresponding PCIst values in wake (W) and anesthesia. Empty and filled symbols indicate more anterior and more posterior regions, respectively, where the recording electrode was located. Mice are arranged following the order in Figure 6 (anesthesia data are missing in 3 mice). Areas are labeled in Figure 6. Cases in which ERPs were absent in wake (n = 3) are not included.
(D) Group level changes in PCIst between wake and anesthesia.
Next, we tested whether the optogenetic stimulation triggers OFF periods also in mice (Figure 8). Independent of whether the stimulation was anterior or posterior, OFF periods were consistently recorded from PtA during NREM sleep but were absent in wake; during REM sleep OFF periods were either absent or, when present, they were followed by a rebound firing that exceeded the pre-stimulation levels. In prefrontal cortex, by contrast, long OFF periods followed by strong rebound firing occurred in all states.
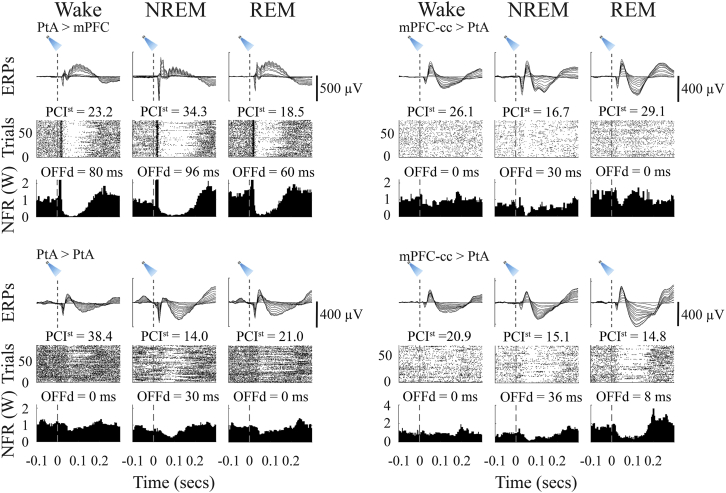
OFF periods triggered by optogenetic stimulation in mice
Four examples of ERPs (top), corresponding changes in firing rate across all trials (middle) and mean changes in firing rate (normalized to the wake values, NFR). In each example, the first and second cortical area indicate the site of stimulation and recording, respectively. OFFd, duration of the evoked OFF period.
Finally, we tested whether the stimulation had differential effects depending on the background activity just before the pulse was delivered. For wake and REM sleep the analyses focused on the amount of theta activity[15],[16],[17] and were performed in rats, whose Neuropixels probes allowed the precise detection of theta activity in the dorsal hippocampus (Figure 9A). Trials were sorted by baseline theta power 1 s before the pulse and by the duration of the evoked OFF periods (Figures 9B and 9F). In both wake and REM sleep we found a negative correlation between pre-stimulation theta activity and the duration of the evoked OFF period (Figures 9C and 9G), although only in REM sleep the latter differed significantly between trials with the lowest and highest theta activity (Figures 9D and 9H). The analysis in NREM sleep was performed in both rats and mice after ranking the trials based on the amount of time spent OFF during the last 0.5 s before the stimulus was delivered (Figure 9J). The ability to evoke an OFF period was negatively correlated with the time spent OFF pre-stimulation (Figure 9K) and trials with longer time spent OFF resulted in significantly shorter evoked OFF periods in mice, and a similar trend in rats (Figures 9L and 9N). Of note, however, within each behavioral state PCIst values did not differ between trials with the lowest and the highest theta (Figures 9E and 9I), or between trials with the most and the least pre-stimulation time spent OFF (Figures 9M and 9O). This is likely because the difference in the duration of the evoked OFF periods between these groups of “low” and “high” trials was small. Moreover, the duration of the evoked OFF periods was shorter in wake and REM sleep than in NREM sleep, even when comparing the most extreme cases, i.e., wake or REM sleep trials with the longest evoked OFF periods (lowest theta; Figures 9D and 9H)) with NREM sleep trials with the shortest evoked OFF periods (most time OFF in baseline; Figure 9L).
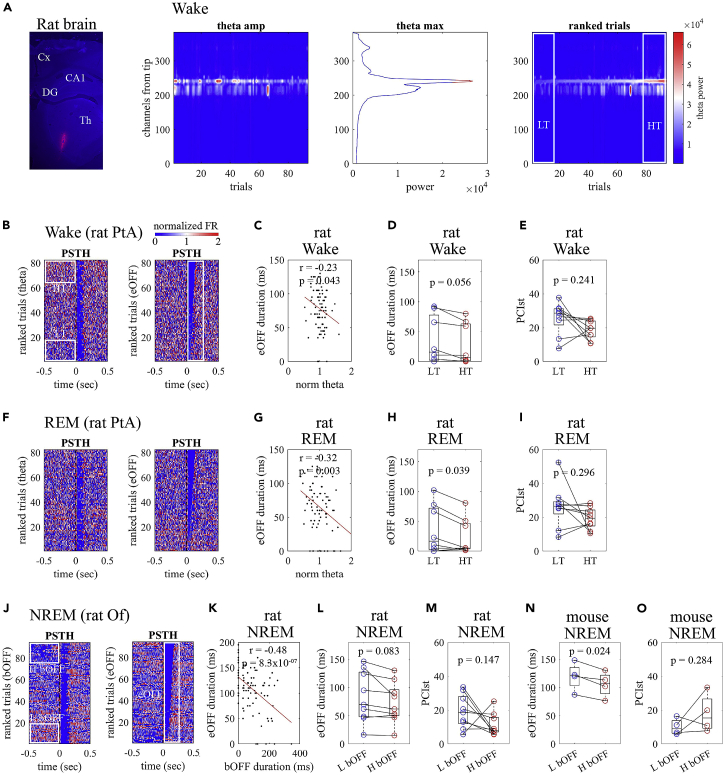
Effects of background activity
(A) From left to right, coronal section from one representative rat showing the location of the Neuropixels probe spanning the dorsal hippocampus (CA1, DG);theta power (5–9 Hz) in the same rat, shown across all wake trials and as a function of recording depth; the peak of theta power is located in the stratum lacunosum moleculare; wake trials ranked according to max theta power.
(B) Multi-unit activity peri-stimulus time histograms (PSTH) locked to electrical stimulation during wake in a parietal probe (PtA; normalized firing rate, FR). Trials were sorted by baseline theta power (last sec before the pulse, left) and by the duration of the evoked OFF periods (eOFF, right).
(C) Correlation between normalized theta power and evoked OFF period duration (same example as in B).
(D) Group level changes (5 rats) in evoked OFF period duration for wake trials with the lowest 20% theta (LT) vs wake trials with the highest 20% theta (HT).
(E) Group level changes (5 rats) in PCIstfor LT and HT wake trials.
(F−I) Same as in B-E, but for REM sleep trials.
(J) Examples of PSTH locked to electrical stimulation during NREM sleep in a frontal probe (Of). Trials were sorted by the amount of time spent OFF during the last 500 ms before the pulse (bOFF; left) and by evoked OFF period duration (right).
(K) Correlation between pre-pulse time spent OFF and evoked OFF period duration (same example as in J).
(L) Group level changes (6 rats) in evoked OFF period duration for NREM sleep trials with the lowest 20% total amount of time OFF (L bOFF) vs trials with the highest 20% (H bOFF; right).
(M) Group level changes (6 rats) in PCIst for L bOFF and H bOFF trials.
(N and O) Same as in L, M, for 3 mice.
Discussion
Measures of perturbational complexity, such as PCI and PCIst, can be used to assess the presence and absence of consciousness without relying on behavioral reports. These indices have been validated in a large number of human subjects in many different conditions[5] and have shown unrivaled sensitivity and specificity.[7] They have also proven their value in inferring the presence and absence of consciousness in unresponsive patients.[5]
Our first goal was to validate the use of PCIst in animal models of spontaneous sleep and wake. We found that PCIst is high in wake and REM sleep and low in NREM sleep in both rats and mice, as it is in humans.[1],[5] In humans, wakefulness is invariably conscious, and REM sleep is most often accompanied by dreaming. By contrast, consciousness frequently fades during NREM sleep, especially early in the night, when the EEG shows high amplitude slow waves, especially in posterior cortex.[18] The similarity of the results obtained in freely moving rodents suggests that PCIst may be used as a reliable readout of the effectiveness of causal interactions in corticothalamic networks that are thought to underlie the capacity for experience.[3]
We also found that, as in humans, PCIst is reduced in rats and mice under deep slow wave anesthesia with sevoflurane and/or dexmedetomidine. These results confirm and extend the findings of a recent study in head fixed rats.[10] In that study, propofol and sevoflurane anesthesia induced large slow waves and led to a decrease in PCIst associated with decreased phase-locking, whereas ketamine anesthesia was associated with wake-like EEG activity and with PCIst values intermediate between wake and propofol/sevoflurane. Thus, in both humans and rodents, conditions characterized by the presence of widespread cortical slow waves (deep NREM sleep, propofol, sevoflurane and dexmedetomidine anesthesia) are associated with low PCIst values, while wake-like EEG activity is associated with intermediate or high PCIst (ketamine anesthesia, REM sleep, wake).
Which cellular and network mechanisms underly the ability of measures of perturbational complexity to reflect the level of consciousness? Theoretical considerations predict that the loss of consciousness should be associated with a breakdown of causal interactions within corticothalamic networks.[3] In patients, deep intracranial stimulation during wake triggered complex and long-lasting cortical evoked responses that were deterministically linked to the initial stimulus.[9] By contrast, the same stimulation during NREM sleep (REM sleep was not studied) triggered a suppression of high frequencies (>20Hz) and an associated increase in low frequencies (<4Hz). Moreover, when cortical activity resumed, it was not phased-locked to the original stimulus, and the cessation of phase locking was correlated in time with the suppression of high frequencies.[9] However, because of the unavailability of unit recordings in humans[9] and rats,10 it could not be determined whether the drop in high frequencies and the loss of a deterministic response during NREM sleep reflects the occurrence of a period of neuronal silence owing to neuronal bistability.
The present recordings in freely moving rats show that phase locking to electrical stimulation was also long in wakefulness and REM sleep and short in NREM sleep. Moreover, unit recordings in both rats and mice demonstrate that low PCIst values during NREM sleep and slow wave anesthesia are indeed associated with the early occurrence of OFF periods. This provides direct support to the hypothesis that sustained causal interactions that lead to high PCIst cannot take place when cortical networks are bistable. In some cases, electrical or optogenetic stimulation during wake or REM sleep also triggered neuronal silence, but the OFF period was shorter than in NREM sleep. Intriguingly, these OFF periods were followed by a strong rebound in cortical firing that was absent in NREM sleep. A local, low-amplitude, short-lasting increase in low frequencies (<4Hz) after deep intracranial stimulation can also occur during wakefulness in humans, whereas the suppression of high frequencies only occurs during NREM sleep.[9] Previous evidence indicates that OFF periods may be triggered by Martinotti cells that powerfully inhibit every other neuronal population.[19] Thus, strong local stimulation may activate Martinotti cells strongly enough to trigger local OFF periods even in wakefulness.[19]
In humans, phase locking was suppressed during NREM sleep predominantly in the alpha and beta bands (8–30 Hz), whereas phase locking in the 30–100 Hz gamma band was short-lasting and comparable in wake and NREM sleep.[9] In our study, phase locking was suppressed in NREM sleep in the 8–40 Hz band but not in the gamma band (40–200 Hz), compared to both wake and REM sleep. Several studies in monkeys have revealed consistent patterns of neuronal dynamics across layers in both frontal and visual areas, with gamma activity being higher in superficial than in deep layers.[20],[21],[22] Alpha/beta rhythms, on the other hand, are higher in deep layers, from where they modulate alpha/beta and gamma activity in the superficial layers.[21],[22],[23],[24] Gamma activity in superficial layers has been associated with feedforward transmission from lower to higher areas, attention, and maintenance of working memory, whereas alpha oscillations have been linked to feedback oscillations.[21],[22],[25],[26] Because PCIst and phase locking values are positively correlated, it may be that the longer phase locking during wake and REM sleep relative to NREM sleep is associated with the activation of feedback loops in cortico-cortical circuits and may sustain the higher spatiotemporal complexity observed in conscious states.[9]
Consistent with the presence of clear functional differences across cortical layers, we also found that the stimulation of both anterior and posterior rat cortex provided consistent PCIst results when applied to the deep and middle layers but not when delivered to the most superficial layers. In the rat primary auditory cortex pyramidal neurons in layer 2/3show more selective and sparser auditory responses compared to layer 5 pyramidal neurons, and correlated activity is strong for local and distal neuron pairs in deep layers but only for local pairs in superficial layers.[27] Large, thick-tufted pyramidal cells of L5b are involved in cortico-subcortical loops, and layer 6 pyramidal cells project to the thalamus, whereas pyramidal cells in L2/3 have the densest cortico-cortical anatomical connections compared to infragranular layers.[28] Thus, together with the activation of feedback loops, the stimulation of neurons in the deep and middle layers is more likely to recruit cortico-thalamic and other cortico-subcortical loops, increasing the probability that a single distant recording site detects a complex evoked response during wake.
On the other hand, at the recording site both superficial and deep channels contributed to high PCIst in wake and REM sleep and low PCIst in NREM sleep and anesthesia. It is currently unknown whether supragranular or infragranular layers, all cortical layers, or only specific cellular populations are especially important to account for the presence and content of consciousness. In humans, a negative slow cortical potential likely originating from supragranular layers[29] appears between stimulus onset and behavioral response only when a near-threshold stimulus is perceived[30] and has been proposed as ‘generalized awareness negativity’, a physiological correlate of consciousness across sensory domains.[31] In mice, on the other hand, deep general anesthesia decouples the signaling from the apical dendrites to the cell body of layer 5 but not of layer ⅔ pyramidal neurons.[32] Thus, loss of consciousness under anesthesia was associated with the impaired activity of pyramidal neurons in deep but not in superficial layers.
In humans, PCIst values are calculated based on EEG or intracranial signals coming from multiple cortical sites. The recent study in anesthetized rats also calculated PCIst using a grid of 16 EEG screws covering bilaterally most of the dorsal cortex.[10] Here, we found that changes in perturbational complexity could be reliably estimated from a single recording probe, albeit one endowed with multiple contacts across its length. We hypothesize that high PCIst values during wake and REM sleep may reflect the triggering of complex reverberatory activity across multiple cortico-thalamic and cortico-cortical loops that impinge on different contacts at different times. By contrast, during NREM sleep, and even more so during anesthesia, this reverberatory activity may be blocked by the widespread occurrence of OFF periods. As shown in Figure 5B, it is sometimes possible to document the triggering of reverberatory activity, in this case a cortico-thalamic volley followed by a cortico-thalamic OFF period, which is brief in wake and REM sleep. This is followed by rebound spiking occurring first in thalamic neurons, possibly triggering secondary cortical activity that is complex and long-lasting in wake and REM sleep, but localized and short-lasting in NREM sleep (see also[33],34).
An intriguing observation is that in rats PCIst changed across vigilance states (high in wake and REM sleep, low in NREM sleep and anesthesia), regardless of the site of stimulation and of whether the recording electrode was placed in anterior or posterior cortex. In mice results were similar, except when recording from prefrontal electrodes, which showed inconsistent PCIst changes with behavioral state. This may be because neural circuits in frontal/prefrontal areas are less developed in mice than in rats.[35] However, a key methodological difference is that in rats we used high-intensity electrical stimulation (as in humans), likely recruiting a broad cortical network and fibers of passage. In mice, we used instead optogenetic stimulation to selectively target neighboring excitatory pyramidal neurons. This was adequate to trigger complex responses from posterior cortex during wake and REM sleep, but not from anterior cortex. Perhaps anterior areas may be organized in a way less suitable for sustaining causal interactions that are both integrated and differentiated, and thereby consciousness, in line with lesion, stimulation, and recording studies.[36]
Overall, our experiments show that measures of perturbational complexity can be used for the reliable assessment of vigilance state in rodents. In humans, purely behavioral readouts, even refined ones such as the Glasgow Coma scale revised, administered by expert neurologists, result in a substantial proportion of false negatives in unresponsive patients. In animals, behavioral readouts such as the righting reflex are even more difficult to evaluate.[37],[38] Thus, PCIst may offer a promising proxy for assessing consciousness in animals, with potential benefits in terms of research ethics and well-being.
Limitations of the study
In this work, we found that changes in perturbational complexity could be estimated from a single probe recording from one cortical area, but we did not sample all areas. We also did not assess how subcortical areas might contribute to changes in perturbational complexity. Lastly, although we tried to use weak electrical or optogenetic pulses, we cannot totally rule out that nearby areas or passing fibers may have been recruited during the cortical stimulation.
STAR★Methods
Key resources table
| REAGENT or RESOURCE | SOURCE | IDENTIFIER |
|---|---|---|
| Antibodies | ||
| Rabbit Polyclonal Anti-Glial Fibrillary Acidic Protein | Agilent | Cat# Z0334; RRID: AB_10013382 |
| Donkey Polyclonal Anti-Rabbit | Jackson ImmunoResearch | Cat# 711-585-152; RRID: AB_2340621 |
| Experimental models: Organisms/strains | ||
| Mouse: B6.Cg-Tg(Camk2a-cre)T29-1Stl/J | The Jackson Laboratory | RRID: IMSR_JAX:005359 |
| Mouse: B6.Cg-Gt(ROSA)26Sortm32(CAG−COP4∗H134R/EYFP)Hze/J | The Jackson Laboratory | RRID: IMSR_JAX:024109 |
| Rat: Sprague Dawley Crl:CD(SD) | Charles River | RRID: RGD_734476 |
| Software and algorithms | ||
| MATLAB R2019b and R2021b | MathWorks | https://www.mathworks.com/products/matlab.html |
| SpikeGLX software | Github | http://billkarsh.github.io/SpikeGLX/ |
| Synapse software | TDT Tuker-Davis Technologies | https://www.tdt.com/component/synapse-software/ |
| OpenEx software | TDT Tuker-Davis Technologies | https://www.tdt.com/component/openex-software-suite/ |
| e3Vision software | White Matter | https://white-matter.com/products/e3vision/ |
| DAQ Synchronization | Project from the Optogenetics and Neural Engineering Core at the University of Colorado Denver | https://optogeneticsandneuralengineeringcore.gitlab.io/ONECoreSite/projects/DAQSyncronization/ |
| Visbrain Sleep | Github | https://github.com/TomBugnon/visbrain |
| KiloSort 2.5 | github | https://github.com/cortex-lab/KiloSort |
| ecephys_spike_sorting toolbox | github | https://github.com/jenniferColonell/ecephys_spike_sorting |
| Phy | github | https://github.com/cortex-lab/phy |
| Spike Interface | github | https://github.com/SpikeInterface/spikeinterface |
| mtspecgramc function | http://chronux.org/ | http://chronux.org/chronuxFiles/Documentation/chronux/spectral_analysis/continuous/mtspecgramc.html |
| PCIst function | github | https://github.com/renzocom/PCIst |
| Cavelli-Mao-2022 code | github | https://github.com/cavelligonca/Cavelli-Mao-2022 |
Resource availability
Lead contact
Additional information and requests for resources and reagents should be sent and will be fulfilled by the lead contact, Chiara Cirelli (ccirelli@wisc.edu).
Materials availability
This study did not generate new unique reagents.
Experimental model and subject details
Experimental animals
Adult rats (Sprague Dawley, males, 300–340 g, 2-3 months old; RRID: RGD_734476) and adult mice (CaMKIIα:ChR2 mice, both sexes, 19-28 g, 2-3 months old) were maintained on a 12 h light/12 h dark cycle with food and water available ad libitum (21–26°C, 30–40% relative humidity). CaMKIIα:ChR2 mice were obtained by crossing CaMKIIα-Cre mice (Jackson Laboratory; T29-1; RRID: IMSR_JAX:005359) with Cre-dependent ChR2(H134R)/EYFP expressing mice (Jackson Laboratory; Ai32; RRID: IMSR_JAX:024109). All animals were group housed until the time of surgery and randomly assigned to experimental groups. All animals were healthy, drug naive, and were not used in previous procedures. All animal procedures and experimental protocols followed the National Institutes of Health Guide for the Care and Use of Laboratory Animals and were approved by the licensing committee. Animal facilities were reviewed and approved by the institutional animal care and use committee (IACUC) of the University of Wisconsin-Madison and were inspected and accredited by the association for assessment and accreditation of laboratory animal care (AAALAC).
Method details
Surgical procedures
Rats
Stereotactic implant of the recording and stimulation electrodes was performed under isoflurane anesthesia (3% induction, 1.5–2.5% maintenance). Using sterile techniques, a midline incision was made to expose the skull and after cleaning the surface with bonding agent (OptiBond™), several small burr holes were made in the skull using a dental drill. Two stainless steel screws (0.8 mm tip diameter) were implanted to serve as ground for the stimulation probe (over contralateral olfactory bulb) and ground and reference for the recording probes (over the cerebellum). A 16-channel probe (NeuroNexus Technologies; A1x16-3mm-100-703-CM16LP) was implanted perpendicular to the cortical surface to be used as stimulation electrode, together with 1 or 2 Neuropixels 1.0 recording electrodes.[39] The Neuropixels probes implanted in the frontal cortex (A/P +3.4, M/L +1.0 or A/P +4.2, M/L +2.0 angled toward the midline), reached secondary motor cortex (M2), prelimbic cortex (A32, PrL), or ventral/lateral orbital area (VO or LO). For simplicity, from here on we refer to VO and LO as orbitofrontal cortex (Of). In several animals, before insertion, the shank of the probes was coated with a red fluorescent cell-labeling solution (CM-Dil, Thermo Fisher Scientific) for later electrode track localization in postmortem histology. After probe alignment, insertion was performed using a robotic micromanipulator (New Scale Technologies) at a speed of 5 μm/s. At the end of the insertion the holes were sealed with silicone elastomer (Kwik-Sil) and electrodes and probes were fixed to the skull using dental cement (C&B Metabond). The implant was protected using a 3D-printed headcap based on the OpenEphys shuttleDrive enclosure.[40] At the end of surgery the margins of the implant were cleaned and antibiotic ointment was applied.
Mice
Surgery was performed under isoflurane anesthesia (2.0% induction; 0.8–1.5% maintenance) following sterile techniques. CaMKIIα:ChR2 mice of both sexes were implanted with optic fibers (Doric Lenses; core diameter = 200 μm; NA = 0.22; diffuser layer tip) for optogenetic stimulations in either posterior (n = 9; 3 females) or anterior (n = 3; 1 female) cortex. For mice with posterior stimulation, optic fibers were placed on the cortical surface over the posterior parietal association cortex (PtA) (A/P −2.00, M/L ±1.80). For mice with anterior stimulation, optic fibers were implanted deeply in the cortex (A/P +1.93, M/L ±1.65, or A/P +1.77, M/L −0.60, angled toward the midline), to target anterior cingulate cortex (i.e., A24, Cg) and infralimbic cortex (i.e. A25, IL). For simplicity, from here on we refer to this targeted region together with PrL as mPFC (medial prefrontal cortex).[41],[42],[43]
To perform electrophysiology recordings, all mice were also implanted with laminar silicon probes (NeuroNexus Technologies; A1x16-3mm-50-177-CM16LP, A1x16-5mm-50-177-CM16LP, or A4x4-3mm-50-125-177-CM16LP), EEG and electromyogram (EMG) electrodes. To facilitate histological localization, in some cases the silicon probe shanks were coated with CM-DiI immediately before implantation. A right frontal silicon probe was implanted deeply in the cortex (A/P +1.93, M/L +0.40, or A/P +1.77, M/L +0.50, angled toward the midline), with electrodes targeting mPFC (Cg, IL or PrL). A left posterior parietal silicon probe was implanted in PtA (A/P −2.00, M/L −2.20), with electrodes targeting all layers. Reference screws were implanted over the cerebellum and olfactory bulb. EEG screw electrodes were implanted over left M2 (A/P +2.50, M/L −1.50) and right secondary somatosensory cortex (S2; A/P −1.30, M/L +4.0). EMG stainless steel wires were implanted bilaterally in the dorsal neck musculature and in the whisker musculature. The craniotomies and silicon probes were covered with surgical silicone adhesive (Kwik-Sil), and all implants were fixed to the skull with dental cement (C&B-Metabond, Fusio™ or Flow-It ALC™, Pentron).
Experimental procedures and design
Rats
After surgery, all rats were kept in a temperature-controlled room (21-24°C) with a 12:12 light/dark cycle (light on at 9a.m.) and with water and food available ad libitum. Rats were single housed in a transparent recording box (53 × 32 × 46 cm) containing bedding material and fully enclosed in a Faraday cage. After at least one week of recovery, the probes were connected to the recording system through a protection spring linked to a commutator, to allow free movements. After two days of adaptation, continuous recordings were performed for at least 48 h to evaluate the sleep/wake pattern in baseline conditions, followed by 6 h of sleep deprivation with novel objects (9a.m. to 3p.m.) and subsequent sleep rebound (3p.m. to 9a.m. the next day) to assess the homeostatic response to sleep loss (see OFF period analysis). Several days after sleep deprivation the stimulation sessions started and were conducted only during the light period, between 10a.m. and 8p.m., during wake, NREM sleep, REM sleep, as well as during anesthesia with sevoflurane (2%) or dexmedetomidine (0.1 mg/kg, IP). Most of the rats were exposed to both anesthetics in a randomized order. Electrical stimulation of the cortical tissue was performed by delivering a vertical, 200-300 μm, bipolar, monophasic, current pulse of 0.5 ms of various intensities (30-100 μA across rats). The depth of stimulation varied across experiments, always with cathode ventral. In each animal, a single stimulation intensity was used, corresponding to the weakest stimulus capable of triggering a slow wave during NREM sleep.[44] Local field potentials (LFPs) and behavior were continuously monitored by the experimenter and stimuli were delivered only during consolidated episodes of wake and sleep, with the final goal of collecting 110 pulses for each behavioral state. In each session, stimuli were spaced apart at least 10 s, with often longer intervals to avoid sleep/wake state transitions. Shorter intervals (at least 4 s) were sometimes used for REM sleep, whose bouts normally last approximately 100 s and account for less than 10% of the total behavioral time.[45] In each rat stimulation sessions spanned 2 to 4 weeks, interleaved with resting periods of at least 48 h.
Mice
After surgery, all mice were kept in a temperature-controlled room (24-26°C) with a 12:12 light/dark cycle (light on at 10a.m.) and with water and food available ad libitum. Mice were individually housed in transparent plastic cages (Allentown Caging; 24.5 × 21.5 × 21 cm). The implanted silicon probes, electrodes and optic fibers were connected to the recording/stimulation system around one week after surgery to allow for recovery. Baseline recordings were acquired after the mice were accustomed to the system, then the experiments started after the temporal organization of sleep and wakefulness had normalized. All stimulation sessions were conducted during the light period. The implanted optic fibers were connected to a blue laser station (473 nm, OEM Laser Systems DPSSL Driver, 100 mW), which is triggered by the TDT system, with the laser output power manually controlled by an analog control knob on the driver. Based on the excitation threshold of specific opsins,46,[47],[48] and the intended activation radius in the target area, the laser power to start with was estimated based on an established online calculator (https://web.stanford.edu/group/dlab/cgi-bin/graph/chart.php), which is modeled based on direct measurements in mammalian brain tissue. Laser power ranged from 0.2 to 2.9 mW (across mice) at the tip of the optic fiber, and laser trains (8 ms pulse width, 2000 ms off between pulses, around 15 pulses per train) were delivered. Like in rats, the stimulation amplitude in each mouse was set as the weakest one capable of triggering a slow wave during NREM sleep. Behavior and electrophysiology data were continuously monitored by the experimenter, and stimuli were delivered during wake, NREM sleep, REM sleep, and under anesthesia with sevoflurane (1.0–2.0%) co-administered with dexmedetomidine (70-100 μg/kg, IP). The final goal was to collect around 80 pulses for each consolidated behavioral state.
Histology
Rats
At the end of the last recording session, under general anesthesia (isoflurane 2-3%), rats were intracardially perfused with PBS (phosphate buffer solution with heparin 5000 IU/L) and 4% paraformaldehyde (PFA) in PBS for tissue fixation. Brains were then extracted and processed for histology. After fixation, brains were cryoprotected by exposure to increasing concentration of sucrose in PBS solutions at 4°C. Brains were then quickly frozen and sliced in coronal sections (40-50 μm thick) with a cryostat (Thermo Fisher Scientific; CryoStar™ NX50). Sections were dried overnight and mounted with medium containing DAPI (SouthernBiotech™; DAPI-Fluoromount-G). In some animals in which CM-DiI was not applied the sections were subjected to cresyl-violet (Nissl) staining. To verify the probe location sections were imaged with an upright epifluorescence microscope (Leica; DM2500).
Mice
To verify opsin expression, recording and cannula locations, mice were transcardially perfused under deep anesthesia (3.0% isoflurane, with a flush (∼30 s) of saline followed by 4% paraformaldehyde (PFA) in phosphate buffer (PB). Brains were removed and postfixed for 24 h in the same fixative, then cut in 50um thick coronal sections on a cryostat (CryoStar™ NX50 or Leica CM1900) after cryoprotection and flash-freezing. Sections were collected in PBS, mounted, air-dried, cover slipped (DAPI-Fluoromount-G, Vectashield, or Permount) and examined under a fluorescent or confocal microscope (Leica, Olympus). In some animals, to localize the silicon probes without fluorescent dye coating, glial fibrillary acidic protein (GFAP) staining was performed (rabbit-anti-GFAP primary antibody, DAKO Z0334, 1:1000 in blocking solution; Donkey-anti-Rabbit AF594 secondary antibody, 1:500 in blocking solution). In some cases Crystal Violet staining was performed to better visualize the location of the cannulas. To characterize the opsin expression of the CaMKIIα:ChR2 mice, in pilot experiments in 2 mice eYFP amplification staining was performed (rabbit anti-GFP primary antibody, Invitrogen, A11122, 1:1000 in blocking solution; goat anti-rabbit Alexa 488 conjugated secondary antibody, Invitrogen, A11008, 1:1000 in blocking solution).
Electrophysiological recordings and stimulation
Rats
Electrophysiological recordings were performed using available Neuropixels 1.0 acquisition hardware.[49] Neuropixels probes consist of a single shank (70 μm wide; 24 μm thick, 10 mm long) with 960 electrodes (2 columns; inter-electrode distance 20 μm), of which 384 can be recorded simultaneously (neuropixels.org). All experiments used the same electrode mapping, with a simple column expanding for 7.64 mm starting at the tip of the probe. Probes were connected to a head stage that transmit the data to a PXIe acquisition module mounted in a PXI chassis (National Instruments; PXIe-1071 chassis). The SpikeGLX software was used to acquire and visualize the data (https://github.com/billkarsh/SpikeGLX). In each probe the signal was amplified (x 500), digitized (10 bits) and filtered in two bands, one for the LFPs (0.5–500 Hz) and one for action potentials (AP; 0.3–10 kHz). LFP and AP signals were digitized at 2.5 and 30 kHz respectively with some small variation applicable after in brain calibration. Electrical stimulation was performed using a battery-powered 32 channels microstimulator system (Tucker-Davis Technologies; IZ2-32) connected to the 16 channels probe throughout a passive head stage and controlled with an electrophysiological recording software (Tucker-Davis Technologies; Synapse). Stimulus parameters and applied currents were recorded simultaneously in all channels.
All sessions were recorded with video (White Matter LLC; e3Vision system), and all data streams (video, stimulation, electrophysiology, etc.) were synchronized offline using digital barcodes as described by the DAQ Synchronization Project from the Optogenetics and Neural Engineering Core at the University of Colorado Denver (https://optogeneticsandneuralengineeringcore.gitlab.io/ONECoreSite/projects/DAQSyncronization/).
Mice
Electrophysiological recording and optogenetic stimulation were performed using RZ2 BioAmp processor and OpenEx software (Tucker-Davis Technologies). Silicon probes were connected through a head stage to an amplifier (Tucker-Davis Technologies; PZ5 NeuroDigitizer Amplifier) before reaching the RZ2 processor. EEGs and LFPs were filtered by 0.1–100Hz, and multi-unit activities (MUAs) were filtered by 0.3-5 kHz. Sampling rate for storage was 256Hz for LFPs, EEGs and EMGs; 25 kHz for MUAs. Spike data were collected discreetly from the same LFPs channels. Amplitude thresholds for online spike detection were set manually based on visual control. Whenever the recorded voltage exceeded a predefined threshold, a segment of 46 samples (0.48 ms before, 1.36 ms after the threshold crossing) was extracted and stored for later use. All sessions were recorded with video.
Sleep scoring and data processing
Sleep scoring was performed manually using a fork (https://github.com/TomBugnon/visbrain) of Visbrain Sleep,50 which includes several enhancements to facilitate the scoring of non-human sleep. Analysis of electrophysiological data was performed in MATLAB R2019b and R2021b (MathWorks). LFP data were visually inspected to remove artifacts. Isolated bad channels were replaced by the mean of the immediately surrounding good channels. All LFP channels were subjected to linear detrend and lowpass filtering (200 Hz), using a zero-phase distortion third order Butterworth filter. Single trials were extracted in a ±4 s window using stimulation time as zero. All trials and channels were visually inspected (SpikeGLX). Trials were discarded if there were artifacts in the few seconds around the stimulus, or when the stimulus was delivered close to a sleep/wake transition.
PCIst
The spatiotemporal complexity of cortical event related potentials (ERPs) was quantified using a variant of the original perturbational complexity index or PCI,1,[51] called the PCI state transition (PCIst) variant.[6] With this method the principal components accounting for at least 99% of the variance present in the ERP response are obtained through singular value decomposition and then selected based on their own baseline level (signal-to-noise ratio, SNRmin). The number of state transitions (NST) is then measured for each principal component during baseline (−800 to −100 msecs) and after the stimulus (10–800 msecs). NST is a measurement adapted from recurrent quantification analysis over the ERP distance matrices.[6] PCIst is the sum of the differences in NST between the baseline and the response for each principal component. Results did not significantly change depending on whether the post-stimulus time interval used for the analysis started 10 msec after the stimulus or at the peak or the end of the slow wave induced by the stimulation, nor did they change when the duration of the post-stimulus time interval increased from 10-800 msec to 10-1000 msec.
Phase locking factor (PLF)
The instantaneous PLF was calculated as in[9],[52] to determine how the stimulation affected the phase of ongoing oscillations across trials. To focus on phase coupling that could only be explained by the stimulus, we assumed a Rayleigh distribution of the PLF values during baseline (−600 to −100 ms), and then performed a statistical comparison with the baseline for each electrode. PLF values below threshold (α < 0.05) were set to zero. Initially, the spectral PLF contribution was calculated using a moving band-pass filter window that ranged from 0 to 200 Hz (4 Hz width; 2 Hz superposition) and for each band the instantaneous PLF was calculated. In agreement with previous experiments in humans,9 this analysis revealed that the 8 to 40 Hz frequencies, encompassing the alpha and beta bands, but not the higher frequencies (40-200 Hz), were useful to distinguish between wake and NREM sleep, as well to distinguish between NREM sleep and REM sleep. Thus, all final PLF analyses used the 8 to 40 Hz frequency range.
Detection of spontaneous and evoked slow waves
Detection of individual slow waves was performed as previously described[44],[53],[54] on the spontaneous LFP signal during baseline sleep, recovery sleep after sleep deprivation (3PM–5PM) and during the induction of slow waves by electrical stimulation. From the continuous recording, all NREM windows were extracted based on standard criteria for scoring vigilance states: wake was characterized by a low-voltage, high-frequency LFP activity and phasic muscle activity; NREM sleep was characterized by the occurrence of high-amplitude slow waves, spindles, and low tonic muscle activity; in REM sleep, cortical LFPs resembled those seen in wake but muscle tone was absent, with the exception of occasional twitches. Waveforms were detected using a bipolar transcortical arrangement[44] between deep and superficial LFPs cortical channels (layers 5-6 vs. layers 1-2). The signal was first filtered in the slow activity band (0.5–4 Hz; ChebyshevType II filter) and all positive and negative peaks were detected. Slow waves were defined as positive deflections between two consecutive negative deflections below the zero-crossing with a duration of at least 100 ms, as in previous studies.[53] Only slow wave with an amplitude greater than the 75th percentile were used.[19] Slow wave polarity reversal in the dorsoventral axis, along with the presence of a peak in high gamma power in mid-layer 5, and histology were used to estimate the electrode location.[12],[13],[19],[55]
Spike analysis
Pre-processing
Recordings were preprocessed separately with the CatGT command-line tool (github.com/billkarsh/SpikeGLX), performing 300–9000Hz band-pass filtering, global demultiplexing common average referencing and automatic artifact detection and removal with default parameters.
Spike sorting
For each animal, probe and each stimulation depth, the preprocessed recordings containing the wake, NREM sleep and REM sleep pulses were then concatenated into a single recording on which spike sorting was performed using the Kilosort2.5 algorithm.[11] Recordings for the sevoflurane condition were sorted separately. In order to account for fast and slow drift, the algorithm first performs a drift correction pre-processing step[56]: for each temporal batch, a fingerprint of the distribution of units along the probe is constructed from the histogram of spike amplitudes at each channel. This fingerprint is used to compute, for each temporal batch, the vertical offset of each channel relative to a template obtained from iterative averaging of the rigidly aligned fingerprints. The data used for sorting is then corrected using kriging interpolation. Since we did not observe significant drift on fast timescales, we used 8 s batches (instead of the default 2 s) to increase the reliability of the batches' fingerprint. Besides the batch size, we used default values for all but two kilosort parameters: the projection thresholds Thwere set to [12 10] instead of [10 5] and lambda was set to 50 instead of 10, as we observed that these values reduced the number of putative false positive spike detections in our data.
Postprocessing, curation and unit selection
We used Jennifer Colonnell’s fork of the Allen institute’s ecephys_spike_sorting toolbox to postprocess kilosort’s output (https://github.com/jenniferColonell/ecephys_spike_sorting). This allowed us to mark some of the clusters as noise based on their template’s spatial and temporal spread and remove the spikes occasionally double-counted by Kilosort. We then removed the remaining noise clusters using phy (https://github.com/cortex-lab/phy). Finally, we excluded all clusters with firing rate below 0.5 Hz. Overall, the total number of clusters throughout the probe selected for further analyses ranged from 65 to 402. Sorting data was extracted using the SpikeInterface toolbox.[57]
OFF period detection
Peri stimulus time histograms (PSTH)
For the analysis of spikes locked to electrical or optogenetic stimulation, all time stamps corresponding to individual spike occurrences were concatenated across all recording channels showing single and/or multi-unit activity. 4 ms bin firing rate from −1 to +1 s, relative to stimulation time, was isolated and normalized to the baseline firing rate, defined as 1 to 0.4 s before the stimulation during wake.
Peri slow wave time histograms (PSWTH)
For the analysis of spikes locked to slow waves, all time stamps corresponding to individual spike occurrences were concatenated across all recording channels showing single and/or multi-unit activity. 4 ms bin firing rate from −1 to +1 s, relative to the slow-wave zero crossing, was isolated and normalized to the baseline firing rate, defined as 1 to 0.4 s before the slow wave zero crossing.
OFF periods
Using both PSTH and PSWTH, the time when the firing rate drops below 25% of the baseline was defined as the onset of the OFF period, while the start of the ON period was defined as the time when the firing rate rose above 25% of the baseline. OFF duration is equal to ON start time minus OFF start time. Similar criteria were used at the single trial level to detect the evoked OFF periods and the amount of time OFF during the period before the stimulation. “Effectiveness” was defined as the percentage of trials with evoked OFF periods of at least 30 ms.
Current source density analysis (CSD)
For CSD analysis[55],[58] the following formula was applied:
Im = (1/R) = (Φi + 10 -2 Φi + Φi-10)/(Z2).
where Φi is the field potential in mV at a given electrode i, R is in MΩ, Z is the distance between electrodes in mm, Im is CSD in μV/μm2. Im > 0 and Im < 0 indicate Source (outward current) and Sink (inward current), respectively.
Quantification and statistical analysis
The data were expressed as mean ± SD. The significance of the differences among behavioral states was evaluated with repeated measures ANOVA, with the Greenhouse-Geisser correction, along with Tukey post hoc tests. For the comparison between waking and anesthesia a paired t-test was performed. A measure of effect size was reported for rmANOVA (η2) and t-test (d). The criterion used to reject null hypotheses was p < 0.05. Details can be found in the results and figure legends.
Acknowledgments
Supported by U.S. Department of Defense grant W911NF1910280(CC, GT), NIH grant 1R01GM116916(GT), the Tiny Blue Dot Foundation (GT) and the Templeton World Charity Foundation (CC).
Author contributions
M.L.C. and R.M. conducted the experiments, performed analysis, and wrote parts of the paper; G.F., K.D., and T.B. performed analysis; G.T. and C.C. designed the experiments and wrote the paper.
Declaration of interests
Giulio Tononi is Chair of Board and has a financial interest in Intrinsic Powers Inc. Relevant patent: US 8,457,731 B2 (Method for assessing anesthetization; GT). All other authors declare no competing financial or non-financial interests.
Published: February 13, 2023
Data and code availability
Data reported in this paper will be shared by the lead contact upon request. This paper does not report original code but the analysis scripts are available (https://github.com/cavelligonca/Cavelli-Mao-2022). Any additional information required to reanalyze the data reported in this paper is available from the lead contact upon request.
References
- Casali A.G., Gosseries O., Rosanova M., Boly M., Sarasso S., Casali K.R., Casarotto S., Bruno M.-A., Laureys S., Tononi G., Massimini M. A theoretically based index of consciousness independent of sensory processing and behavior. Sci. Transl. Med. 2013;5:198ra105. doi: 10.1126/scitranslmed.3006294.
- Tononi G. An information integration theory of consciousness. BMC Neurosci. 2004;5:42. doi: 10.1186/1471-2202-5-42. 1471-2202-5-42 [pii]
- Tononi G., Boly M., Massimini M., Koch C. Integrated information theory: from consciousness to its physical substrate. Nat. Rev. Neurosci. 2016;17:450–461. doi: 10.1038/nrn.2016.44.
- Tononi G., Sporns O., Edelman G.M. A measure for brain complexity: relating functional segregation and integration in the nervous system. Proc. Natl. Acad. Sci. USA. 1994;91:5033–5037. doi: 10.1073/pnas.91.11.5033.
- Casarotto S., Comanducci A., Rosanova M., Sarasso S., Fecchio M., Napolitani M., Pigorini A., G Casali A., Trimarchi P.D., Boly M., et al. Stratification of unresponsive patients by an independently validated index of brain complexity. Ann. Neurol. 2016;80:718–729. doi: 10.1002/ana.24779.
- Comolatti R., Pigorini A., Casarotto S., Fecchio M., Faria G., Sarasso S., Rosanova M., Gosseries O., Boly M., Bodart O., et al. A fast and general method to empirically estimate the complexity of brain responses to transcranial and intracranial stimulations. Brain Stimul. 2019;12:1280–1289. doi: 10.1016/j.brs.2019.05.013.
- Sarasso S., Casali A., Casarotto S., Rosanova M., Sinigaglia C., Massimini M. Oxford Academic; 2021. Consciousness and Complexity: AConsilience of Evidence Neuroscience of Consciousness; p. niab023.
- Steriade M., Nuñez A., Amzica F. A novel slow (< 1 Hz) oscillation of neocortical neurons in vivo: depolarizing and hyperpolarizing components. J. Neurosci. 1993;13:3252–3265. doi: 10.1523/JNEUROSCI.13-08-03252.1993.
- Pigorini A., Sarasso S., Proserpio P., Szymanski C., Arnulfo G., Casarotto S., Fecchio M., Rosanova M., Mariotti M., Lo Russo G., et al. Bistability breaks-off deterministic responses to intracortical stimulation during non-REM sleep. Neuroimage. 2015;112:105–113. doi: 10.1016/j.neuroimage.2015.02.056.
- Arena A., Comolatti R., Thon S., Casali A.G., Storm J.F. General anesthesia disrupts complex cortical dynamics in response to intracranial electrical stimulation in rats. eNeuro. 2021;8 doi: 10.1523/ENEURO.0343-20.2021. ENEURO.0343, 20.2021.
- Pachitariu M., Steinmetz N., Kadir S., Carandini M., Kenneth D H. Kilosort: realtime spike-sorting for extracellular electrophysiology with hundreds of channels. Preprint. Neuroscience. 2016 doi: 10.1101/061481.
- Valero M., Viney T.J., Machold R., Mederos S., Zutshi I., Schuman B., Senzai Y., Rudy B., Buzsáki G. Sleep down state-active ID2/Nkx2.1 interneurons in the neocortex. Nat. Neurosci. 2021;24:401–411. doi: 10.1038/s41593-021-00797-6.
- Senzai Y., Fernandez-Ruiz A., Buzsáki G. Layer-specific physiological features and interlaminar interactions in the primary visual cortex of the mouse. Neuron. 2019;101:500–513.e5. doi: 10.1016/j.neuron.2018.12.009.
- Stark E., Roux L., Eichler R., Senzai Y., Royer S., Buzsáki G. Pyramidal cell-interneuron interactions underlie hippocampal ripple oscillations. Neuron. 2014;83:467–480. doi: 10.1016/j.neuron.2014.06.023.
- Zhou H., Neville K.R., Goldstein N., Kabu S., Kausar N., Ye R., Nguyen T.T., Gelwan N., Hyman B.T., Gomperts S.N. Cholinergic modulation of hippocampal calcium activity across the sleep-wake cycle. Elife. 2019;8:e39777. doi: 10.7554/eLife.39777.
- Dong Y., Li J., Zhou M., Du Y., Liu D. Cortical regulation of two-stage rapid eye movement sleep. Nat. Neurosci. 2022;25:1675–1682. doi: 10.1038/s41593-022-01195-2.
- Cavelli M., Rojas-Líbano D., Schwarzkopf N., Castro-Zaballa S., Gonzalez J., Mondino A., Santana N., Benedetto L., Falconi A., Torterolo P. Power and coherence of cortical high-frequency oscillations during wakefulness and sleep. Eur. J. Neurosci. 2018;48:2728–2737. doi: 10.1111/ejn.13718.
- Siclari F., Baird B., Perogamvros L., Bernardi G., LaRocque J.J., Riedner B., Boly M., Postle B.R., Tononi G. The neural correlates of dreaming. Nat. Neurosci. 2017;20:872–878. doi: 10.1038/nn.4545.
- Funk C.M., Peelman K., Bellesi M., Marshall W., Cirelli C., Tononi G. Role of somatostatin-positive cortical interneurons in the generation of sleep slow waves. J. Neurosci. 2017;37:9132–9148. doi: 10.1523/JNEUROSCI.1303-17.2017.
- Maier A., Adams G.K., Aura C., Leopold D.A. Distinct superficial and deep laminar domains of activity in the visual cortex during rest and stimulation. Front. Syst. Neurosci. 2010;4:31. doi: 10.3389/fnsys.2010.00031.
- Buffalo E.A., Fries P., Landman R., Buschman T.J., Desimone R. Laminar differences in gamma and alpha coherence in the ventral stream. Proc. Natl. Acad. Sci. USA. 2011;108:11262–11267. doi: 10.1073/pnas.1011284108. 1011284108 [pii]
- Bastos A.M., Loonis R., Kornblith S., Lundqvist M., Miller E.K. Laminar recordings in frontal cortex suggest distinct layers for maintenance and control of working memory. Proc. Natl. Acad. Sci. USA. 2018;115:1117–1122. doi: 10.1073/pnas.1710323115.
- Bollimunta A., Chen Y., Schroeder C.E., Ding M. Neuronal mechanisms of cortical alpha oscillations in awake-behaving macaques. J. Neurosci. 2008;28:9976–9988. doi: 10.1523/JNEUROSCI.2699-08.2008.
- Haegens S., Barczak A., Musacchia G., Lipton M.L., Mehta A.D., Lakatos P., Schroeder C.E. Laminar profile and physiology of the alpha rhythm in primary visual, auditory, and somatosensory regions of neocortex. J. Neurosci. 2015;35:14341–14352. doi: 10.1523/JNEUROSCI.0600-15.2015.
- Lakatos P., Chen C.M., O'Connell M.N., Mills A., Schroeder C.E. Neuronal oscillations and multisensory interaction in primary auditory cortex. Neuron. 2007;53:279–292. doi: 10.1016/j.neuron.2006.12.011. S0896-6273(06)00996-2 [pii]
- van Kerkoerle T., Self M.W., Dagnino B., Gariel-Mathis M.A., Poort J., van der Togt C., Roelfsema P.R. Alpha and gamma oscillations characterize feedback and feedforward processing in monkey visual cortex. Proc. Natl. Acad. Sci. USA. 2014;111:14332–14341. doi: 10.1073/pnas.1402773111.
- Sakata S., Harris K.D. Laminar structure of spontaneous and sensory-evoked population activity in auditory cortex. Neuron. 2009;64:404–418. doi: 10.1016/j.neuron.2009.09.020.
- Harris K.D., Shepherd G.M.G. The neocortical circuit: themes and variations. Nat. Neurosci. 2015;18:170–181. doi: 10.1038/nn.3917.
- He B.J., Raichle M.E. The fMRI signal, slow cortical potential and consciousness. Trends Cogn. Sci. 2009;13:302–309. doi: 10.1016/j.tics.2009.04.004. S1364-6613(09)00116-8 [pii]
- Pins D., Ffytche D. The neural correlates of conscious vision. Cereb. Cortex. 2003;13:461–474. doi: 10.1093/cercor/13.5.461.
- Dembski C., Koch C., Pitts M. Perceptual awareness negativity: a physiological correlate of sensory consciousness. Trends Cogn. Sci. 2021;25:660–670. doi: 10.1016/j.tics.2021.05.009.
- Suzuki M., Larkum M.E. General anesthesia decouples cortical pyramidal neurons. Cell. 2020;180:666–676.e13. doi: 10.1016/j.cell.2020.01.024.
- Urbain N., Fourcaud-Trocmé N., Laheux S., Salin P.A., Gentet L.J. Brain-state-dependent modulation of neuronal firing and membrane potential dynamics in the somatosensory thalamus during natural sleep. Cell Rep. 2019;26:1443–1457.e5. doi: 10.1016/j.celrep.2019.01.038.
- Crunelli V., Hughes S.W. The slow (<1 Hz) rhythm of non-REM sleep: a dialogue between three cardinal oscillators. Nat. Neurosci. 2010;13:9–17. doi: 10.1038/nn.2445.
- Van De Werd H.J., Rajkowska G., Evers P., Uylings H.B.M. Cytoarchitectonic and chemoarchitectonic characterization of the prefrontal cortical areas in the mouse. Brain Struct.Funct. 2010;214:339–353. doi: 10.1007/s00429-010-0247-z.
- Boly M., Massimini M., Tsuchiya N., Postle B.R., Koch C., Tononi G. Are the neural correlates of consciousness in the front or in the back of the cerebral cortex? Clinical and neuroimaging evidence. J. Neurosci. 2017;37:9603–9613. doi: 10.1523/JNEUROSCI.3218-16.2017.
- Fuller P.M., Sherman D., Pedersen N.P., Saper C.B., Lu J. Reassessment of the structural basis of the ascending arousal system. J. Comp. Neurol. 2011;519:933–956. doi: 10.1002/cne.22559.
- Gao S., Calderon D.P. Robust alternative to the righting reflex to assess arousal in rodents. Sci. Rep. 2020;10:20280. doi: 10.1038/s41598-020-77162-3.
- Jun J.J., Steinmetz N.A., Siegle J.H., Denman D.J., Bauza M., Barbarits B., Lee A.K., Anastassiou C.A., Andrei A., Aydın Ç., et al. Fully integrated silicon probes for high-density recording of neural activity. Nature. 2017;551:232–236. doi: 10.1038/nature24636.
- Voigts J., Newman J.P., Wilson M.A., Harnett M.T. An easy-to-assemble, robust, and lightweight drive implant for chronic tetrode recordings in freely moving animals. J. Neural. Eng. 2020;17:026044. doi: 10.1088/1741-2552/ab77f9.
- Carlén M. What constitutes the prefrontal cortex? Science. 2017;358:478–482. doi: 10.1126/science.aan8868.
- Laubach M., Amarante L.M., Swanson K., White S.R. What, if anything, is rodent prefrontal cortex? eNeuro. 2018;5 doi: 10.1523/ENEURO.0315-18.2018. ENEURO.0315, 18.2018.
- Le Merre P., Ährlund-Richter S., Carlén M. The mouse prefrontal cortex: unity in diversity. Neuron. 2021;109:1925–1944. doi: 10.1016/j.neuron.2021.03.035.
- Vyazovskiy V.V., Faraguna U., Cirelli C., Tononi G. Triggering slow waves during NREM sleep in the rat by intracortical electrical stimulation: effects of sleep/wake history and background activity. J. Neurophysiol. 2009;101:1921–1931. doi: 10.1152/jn.91157.2008.
- González J., Prieto J.P., Rodríguez P., Cavelli M., Benedetto L., Mondino A., Pazos M., Seoane G., Carrera I., Scorza C., Torterolo P. Ibogaine acute administration in rats promotes wakefulness, long-lasting REM sleep suppression, and a distinctive motor profile. Front. Pharmacol. 2018;9:374. doi: 10.3389/fphar.2018.00374.
- Nagel G., Szellas T., Kateriya S., Adeishvili N., Hegemann P., Bamberg E. Channelrhodopsins: directly light-gated cation channels. Biochem. Soc. Trans. 2005;33:863–866. doi: 10.1042/BST0330863.
- Madisen L., Mao T., Koch H., Zhuo J.M., Berenyi A., Fujisawa S., Hsu Y.W.A., Garcia A.J., 3rd, Gu X., Zanella S., et al. A toolbox of Cre-dependent optogenetic transgenic mice for light-induced activation and silencing. Nat. Neurosci. 2012;15:793–802. doi: 10.1038/nn.3078. nn.3078 [pii]
- Sidor M.M., Davidson T.J., Tye K.M., Warden M.R., Diesseroth K., McClung C.A. In vivo optogenetic stimulation of the rodent central nervous system. J. Vis. Exp. 2015;51483:51483. doi: 10.3791/51483.
- Putzeys J., Raducanu B.C., Carton A., De Ceulaer J., Karsh B., Siegle J.H., Van Helleputte N., Harris T.D., Dutta B., Musa S., Mora Lopez C. Neuropixels data-acquisition system: ascalable platform for parallel recording of 10 000+ electrophysiological signals. IEEE Trans. Biomed. Circuits Syst. 2019;13:1635–1644. doi: 10.1109/TBCAS.2019.2943077.
- Combrisson E., Vallat R., O'Reilly C., Jas M., Pascarella A., Saive A.L., Thiery T., Meunier D., Altukhov D., Lajnef T., et al. Visbrain: amulti-purpose GPU-accelerated open-source suite for multimodal brain data visualization. Front. Neuroinform. 2019;13:14. doi: 10.3389/fninf.2019.00014.
- Sarasso S., Boly M., Napolitani M., Gosseries O., Charland-Verville V., Casarotto S., Rosanova M., Casali A.G., Brichant J.-F., Boveroux P., et al. Consciousness and complexity during unresponsiveness induced by propofol, xenon, and ketamine. Curr. Biol. 2015;25:3099–3105. doi: 10.1016/j.cub.2015.10.014.
- Palva J.M., Palva S., Kaila K. Phase synchrony among neuronal oscillations in the human cortex. J. Neurosci. 2005;25:3962–3972. doi: 10.1523/JNEUROSCI.4250-04.2005.
- Vyazovskiy V.V., Riedner B.A., Cirelli C., Tononi G. Sleep homeostasis and cortical synchronization: II. A local field potential study of sleep slow waves in the rat. Sleep. 2007;30:1631–1642. doi: 10.1093/sleep/30.12.1631.
- Vyazovskiy V.V., Olcese U., Lazimy Y.M., Faraguna U., Esser S.K., Williams J.C., Cirelli C., Tononi G. Cortical firing and sleep homeostasis. Neuron. 2009;63:865–878. doi: 10.1016/j.neuron.2009.08.024.
- Chauvette S., Volgushev M., Timofeev I. Origin of active states in local neocortical networks during slow sleep oscillation. Cereb.Cortex. 2010;20:2660–2674. doi: 10.1093/cercor/bhq009. bhq009 [pii]
- Steinmetz N.A., Aydin C., Lebedeva A., Okun M., Pachitariu M., Bauza M., Beau M., Bhagat J., Böhm C., Broux M., et al. Neuropixels 2.0: a miniaturized high-density probe for stable, long-term brain recordings. Science. 2021;372:eabf4588. doi: 10.1126/science.abf4588.
- Buccino A.P., Hurwitz C.L., Garcia S., Magland J., Siegle J.H., Hurwitz R., Hennig M.H. SpikeInterface, a unified framework for spike sorting. Elife. 2020;9:e61834. doi: 10.7554/eLife.61834.
- Nicholson C., Freeman J.A. Theory of current source-density analysis and determination of conductivity tensor for anuran cerebellum. J. Neurophysiol. 1975;38:356–368. doi: 10.1152/jn.1975.38.2.356.