# Slides: Exclusion
*The lab's transcriptions of the decks embedded on https://www.iit.wiki/axioms-and-postulates/exclusion: each slide's text as the deck shows it, and in square brackets a description of each diagram, which is the transcriber's and not the deck's.*
## Slideshow 1: Exclusion Postulate - 08/2023
Source page: [Exclusion](https://www.iit.wiki/axioms-and-postulates/exclusion)
Source deck: [Exclusion Postulate](https://docs.google.com/presentation/d/1fAzRN5_nNwLYBt8-8K-wKfFIeNcsGfPYWtegHj8pgpo/edit) (23 slides)
### Title slide (slide 1)
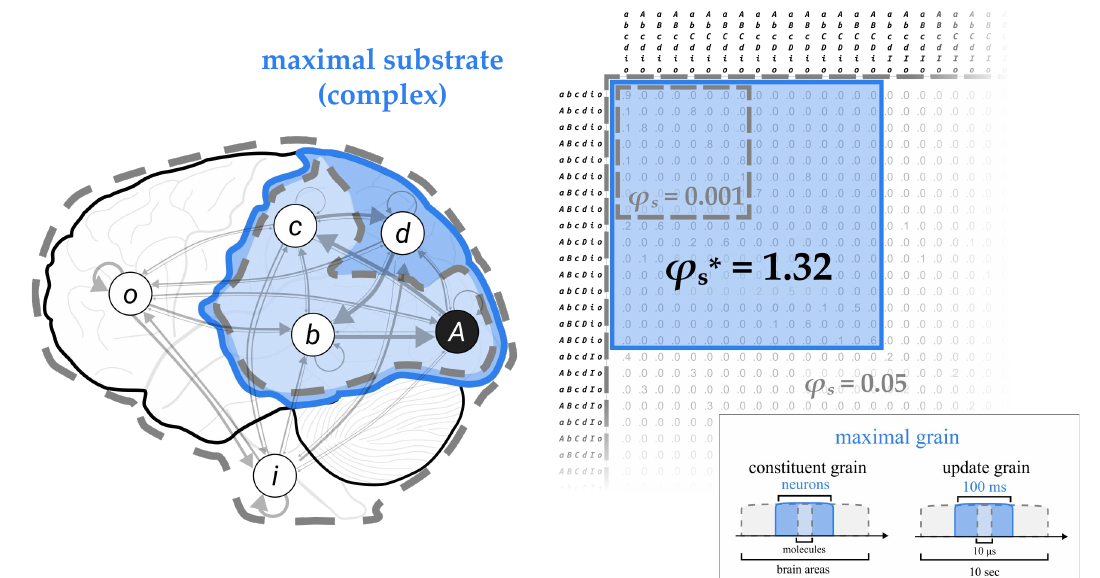
[On the left is the brain with the six units, A ON and the others OFF. Units A, B, C and D lie in a region shaded blue and outlined in solid blue, labelled "maximal substrate (complex)." A smaller dashed grey outline encloses some of these units, standing for a subset, and a larger dashed grey outline surrounds the whole substrate, including O and I, standing for a superset. On the right is the full 64-by-64 substrate TPM. The block for the complex is shaded blue and outlined in solid blue, with "φs* = 1.32" written in it; a smaller dashed grey box inside it is marked "φs = 0.001," and "φs = 0.05" is written beside the whole table. Below is a panel headed "maximal grain," showing two scales, each as a bracket on an axis: the constituent grain (the size of units), where "neurons" is highlighted in blue between "molecules" and "brain areas," and the update grain (the time step), where "100 ms" is highlighted in blue between "10 µs" and "10 sec." A red "(click)" prompt invites the reader to advance.]
### From axiom to postulate (slides 2–5)
**Axiom:** Experience is *definite*: it is *this whole*.
How can we formulate this [phenomenal](https://www.iit.wiki/glossary#h.8j4o0g5ssetv) property in physical terms—that is, in terms of [cause–effect power](https://www.iit.wiki/glossary#h.vlk7u52cim8x)?
**Postulate:** The cause–effect power of the substrate of consciousness must be *definite*: it must specify its cause–effect state as *this whole set* of units.
Note that these slides give a conceptual overview of the postulate without going into the mathematics. Use the links to learn more about key concepts, and visit the [Computing Φ](https://www.iit.wiki/unfolding) page for technical details.
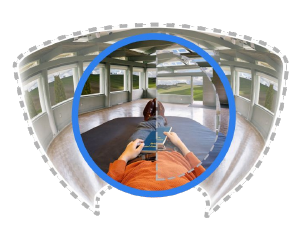
[Beneath the axiom is the wiki's sample experience, a first-person view of lying on a bed with a book in a bright room with wide windows, framed by a solid blue circle. Behind it, a wider, curved view of the same room extends beyond the circle and is outlined in dashed grey, and within the circle the right half of the scene is overlaid with a paler, offset copy. The solid circle marks the experience as this whole, neither more nor less. A blue arrow leads from the axiom to the postulate, which is set above the question.]
### Recap of the integration postulate (slide 6)
Recall in the [integration postulate](https://www.iit.wiki/axioms-and-postulates/integration#h.1019venrnats) that we aimed to capture the intrinsic, specific, unitary cause–effect power of the [candidate system](https://www.iit.wiki/glossary#h.8mzotxp600xu) in its current state (***Abcd***).
We did this by calculating the system integrated information (φs) of ***Abcd*** for its [minimum partition](https://www.iit.wiki/glossary#h.uxjtor35txjh) (**scissors**)—yielding φs = 1.32.
[This slide repeats the final figure of the Integration deck: the partitioned substrate graph with its scissors, and the candidate's TPM with φs = 1.32. The word "scissors" is printed in orange.]
### Every subset and superset (slides 7–9)
The **exclusion postulate** now requires that we repeat these steps for every possible candidate within substrate ***Abcdio***. We are aiming to see whether another candidate has a higher φs than 1.32.
We assess φs for every subset of ***Abcd*** (e.g., ***Abc***)...
…and every superset (e.g., ***Abcdio***).
[Over these slides, the substrate TPM for all six units replaces the candidate's TPM. On slide 7, a dashed blue box encloses the block for ABCD with φs = 1.32 and a dashed blue hexagon encloses ABCD on the graph. On slide 8, a smaller dashed grey outline encloses the subset A, B and C on the graph, and its block in the TPM is marked φs = 0.001. On slide 9, a large dashed grey hexagon encloses all six units, and the whole TPM is marked φs = 0.05. The combined result is shown in the image for slide 11 below.]
### The maximal substrate, or complex (slides 10–11)
Among all candidates, by the [principle of maximal existence](https://www.iit.wiki/glossary#h.qof4052teerl), the one with the highest φs value is called a *maximal substrate* or [*complex*](https://www.iit.wiki/glossary#h.b6fxhbe1r3re). This complex "excludes" from existence any subset or superset of its units.
It also excludes any "parasets"—sets with units from the complex and units outside of it (e.g., ***Abi***)—but this isn't illustrated.
We indicate the complex with φs* and by the solid blue line and shaded blue region. Only now is ***Abcd*** no longer a mere candidate but a bona fide complex.
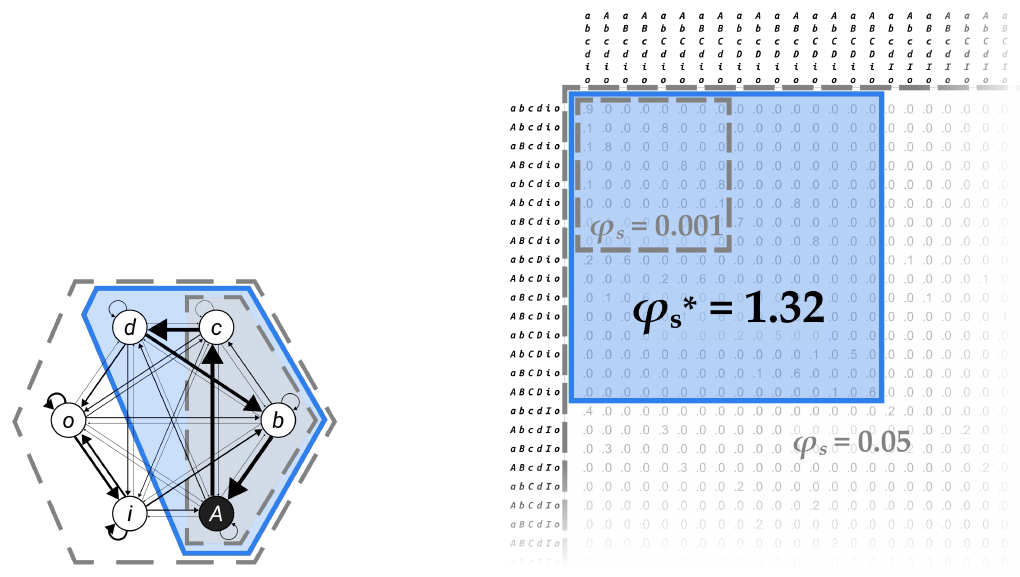
[On the substrate graph, units A, B, C and D lie in a hexagon shaded blue and outlined in solid blue, marking the complex. A smaller dashed grey outline encloses the subset A, B and C, and a larger dashed grey hexagon encloses all six units, marking the superset ABCDIO. In the substrate TPM, the block for the complex is shaded blue with "φs* = 1.32" in large type; a small dashed grey box inside it is marked "φs = 0.001," and "φs = 0.05" is written in grey beside the rest of the table. On slide 10, a callout box carries the note on parasets given above.]
### The remaining units, o and i (slides 12–16)
What about units ***o*** and ***i***?
These have only been excluded from complex ***Abcd***, but they may indeed form a two-unit complex (***io***)…
…or it may turn out that each unit is a complex on its own.
For a given substrate, the *first complex* is the one with the highest φs value, but we can then apply the postulates recursively to also find the second complex, third complex, etc., until every unit of the substrate is accounted for.
Here, for example, we illustrate that ***Abcd*** is the first complex, and that ***i*** and ***o*** individually form [monads](https://www.iit.wiki/glossary#h.otx4utf9u8sn) (complexes of one unit).
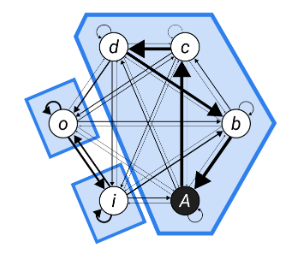
[The complex A, B, C and D is shaded blue and outlined in solid blue, as before. Units O and I, which are no longer pinned, each sit in a small box of their own, also shaded blue and outlined in solid blue, marking them as monads. On slide 13 a single dashed blue box encloses O and I together, as a possible two-unit complex, and on slides 14 and 15 each has its own dashed blue box. On slide 16, a callout box beside the graph carries the final sentence given above.]
### Exclusion applied to the grain of units (slides 17–22)
Finally, the exclusion postulate not only applies to the substrate as a whole but also to its constituent units. In our examples thus far, we have treated **ABCDIO** as our candidate units.
In principle, however, we would have to repeat the operations of the previous postulates at every [constituent grain and update grain](https://www.iit.wiki/glossary#h.wecg9hts0fae) that we can observe and manipulate.
For example, we might find that when we treat ***Ab***, ***cd***, and ***io*** as [macro-units](https://www.iit.wiki/glossary#h.y4l991ydyf0n) (***α***, ***β***, and ***γ***), we get a higher φs* value.
Or if we were to decompose each unit into [micro-units](https://www.iit.wiki/glossary#h.y4l991ydyf0n) (e.g., ***t***, ***s***, ***u***, etc.), we might again discover we get a higher φs* value.
Likewise, we would have to combine each possible constituent grain with each possible update grain—for example, seconds, milliseconds, etc.
In practice, since this sort of exhaustive search is not feasible, we have to resort to estimations and best guesses based on our best empirical knowledge.
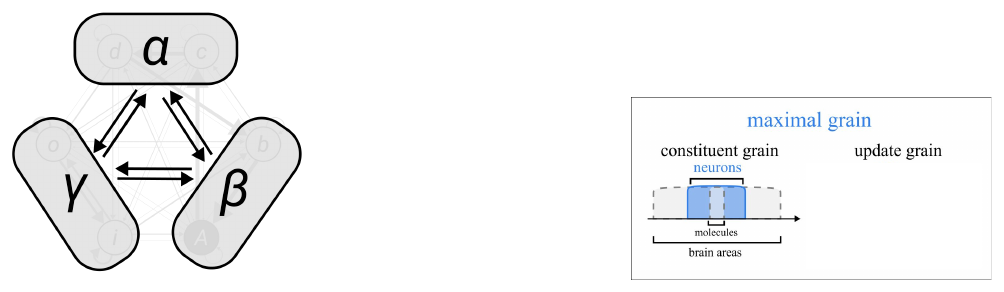
[Three large grey rounded shapes, labelled *α* (top), *β* (lower right) and *γ* (lower left), each enclose two of the original units, which show faintly inside them, and double arrows connect each macro-unit to the other two. Beside them, the "maximal grain" panel shows the constituent-grain scale, with "neurons" highlighted in blue between "molecules" and "brain areas."]
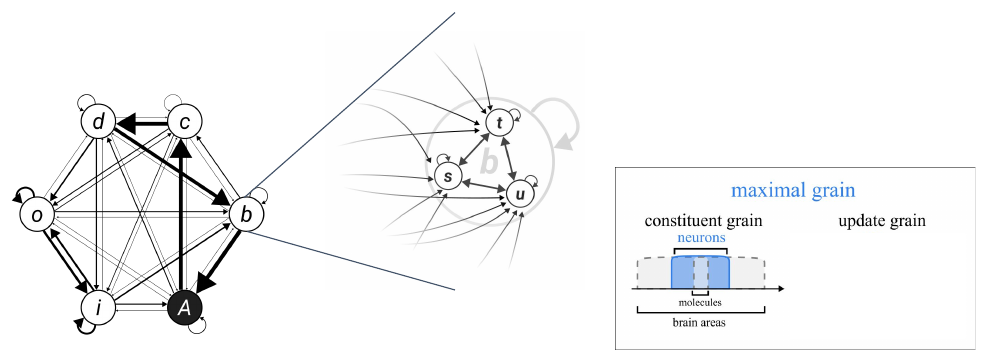
[The six-unit substrate graph is shown again. Two lines fan out from unit B to an enlarged, faded view of it, inside which three smaller units, *t*, *s* and *u*, are connected by many arrows, standing for the micro-units that make up B. The "maximal grain" panel is shown beside it.]
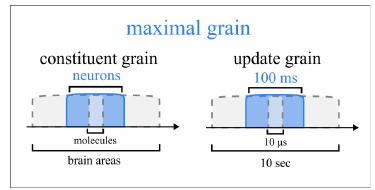
[The panel headed "maximal grain" shows two scales side by side. On the left, "constituent grain": a bracket on an axis marks "neurons," highlighted in blue, as the grain chosen, between the finer "molecules" and the coarser "brain areas." On the right, "update grain": a bracket marks "100 ms," highlighted in blue, between the finer "10 µs" and the coarser "10 sec." On slides 19 and 20 only the constituent grain is filled in. On slide 22, a callout box carries the final sentence given above.]
### Summary slide (slide 23)
[The closing slide, labelled "summary," pairs the axiom and postulate from slide 5, with the photograph of the sample experience ringed in blue, with the diagram from slide 1: the brain with the maximal substrate (complex) shaded blue, the substrate TPM with φs* = 1.32, φs = 0.001 and φs = 0.05, and the maximal grain panel.]